One of the big problems for the first formal asset pricing model developed by financial economists, the CAPM, was that it predicts a positive relationship between risk and return while, empirical studies have found the actual relationship to be basically flat, or even negative. In addition, defensive strategies, at least those based on volatility, have delivered significant Fama-French three-factor and Carhart four-factor alphas.
The superior performance of low-volatility stocks was first documented in the literature in the by Fischer Black in 1972, among others—even before the size and value premiums were “discovered.” The low-volatility anomaly has been shown to exist in equity markets around the world, as well as in bonds (it has been pervasive).
In our book “Your Complete Guide to Factor-Based Investing,” Andrew Berkin and I included an in-depth discussion of the explanations for the existence and persistence of the low volatility anomaly. Among the explanations are:
- Many investors are constrained against the use of leverage (by their charters) or have an aversion to its use. The same is true of short selling.
- Borrowing costs for some hard-to-borrow stocks can be quite high, limiting the ability of arbitrageurs to correct mispricing.
- While an assumption of the CAPM is that markets have no frictions (there are neither transaction costs nor taxes), in the real world there are costs. The evidence shows that the most mispriced stocks are the ones with the highest costs of shorting.
- Regulatory constraints, which often don’t differentiate between the risks of low-volatility and high-volatility stocks, lead some investors to prefer high-volatility stocks.
- The preference for “lottery tickets”—high-volatility stocks with a low average return but a small chance of a large return.
The academic research, combined with the 2008 bear market, led low-volatility strategies to become the darling of investors and cash poured into the strategy. But is it worthy of such admiration as an independent factor? In our book, Berkin and I concluded that while the evidence was strong, it didn’t quite meet all our criteria. Let’s explore why.
Exposure to Other Common Factors Explain Returns to Low Beta
Both Robert Novy-Marx’s 2016 study, “Understanding Defensive Equity,” and Eugene Fama and Kenneth French’s 2015 study, “Dissecting Anomalies with a Five-Factor Model,” found that the low-volatility anomaly was well-explained by asset pricing models that include the newer factors of profitability and investment (in addition to market beta, size and value). The authors of the 2017 paper “Deconstructing the Low-Vol Anomaly,” drew the same conclusion.
Other Issues
Bradford Jordan and Timothy Riley, authors of the 2016 study “The Long and Short of the Vol Anomaly,” found that among high-volatility stocks, only those with low short interest actually experience extraordinary positive returns. On the other hand, those with high short interest experience equally extraordinary negative returns. The bottom line is that high volatility on its own is not an indicator of poor future returns—in other words, it’s not an independent factor.
Another problem for low volatility is that the premium has been highly dependent upon the existing economic regime. In his 2012 paper, “Enhancing a Low-Volatility Strategy is Particularly Helpful When Generic Low Volatility is Expensive,” Pim van Vliet found that while, on average, low-volatility strategies tend to have exposure to the value factor, that exposure was time-varying. The low-volatility factor spent about 62 percent of the time in a value regime and 38 percent of the time in a growth regime. The regime-shifting behavior affects the performance of low-volatility strategies—when low-volatility stocks have value exposure, they, on average, outperformed the market by 2.0%. However, when they have growth exposure, they underperformed by 1.4%, on average. Providing further evidence, the authors of2014 study “Low-Volatility Cycles: The Influence of Valuation and Momentum on Low-Volatility Portfolios,”” found that there was no alpha in a four-factor model except in extremely cheap, low volatility environments. The evidence suggests that investors might be better served by investing in vehicles that screen out high-volatility (or high-beta), high-risk stocks—invest directly in value, profitability/quality, and momentum, rather than doing so indirectly (like defensive strategies do). The research shows not only that returns to the low-volatility anomaly are explained by exposure to other equity factors, but also that they are explained by exposure to the term premium (and, thus, inflation risk)—falling interest rates provide some tailwind, while rising rates provide a headwind.
Term Exposure
The fact that low-volatility strategies have exposure to term risk (the duration factor) should not be a surprise. Low-volatility stocks are more “bond-like” as they are typically large, profitable, dividend paying stocks with mediocre growth opportunities—they are stocks with the characteristics of safety as opposed to risk and opportunity. Thus, they show higher correlations with long-term bond returns.
The findings from the following papers are all consistent in showing low volatility’s exposure to the term factor: The 2014 studies “A Study of Low-Volatility Portfolio Construction Methods” by Tzee-man Chow, Jason Hsu, Li-lan Kuo and Feifei Li and “Interest Rate Risk in Low-Volatility Strategies” by David Blitz, Bart van der Grient and Pim van Vliet demonstrated that low volatility has exposure to the term factor. As an example, using the regression tool at Portfolio Visualizer, we find that over the period November 2011-August 2024 the iShares Edge MSCI Minimum Volatility USA ETF (USMV) had a loading on the market factor of 0.83 and a loading on the term factor of 0.17. That exposure should be considered if including the fund in a portfolio. In addition, as the research shows, the fund’s annual alpha (which includes implementation costs) was negative (-0.73%) with the inclusion of the newer factor of quality, as well as the term and credit factors.
Note that the lower exposure to the market factor and the loading on the term factor suggests that investors could benefit by reallocating assets from bonds to low-volatility equities within their strategic asset allocation, thereby using implicit leverage. Fisher Black had suggested this in his 1993 paper “Beta and Return.”
New Research
Lodewijk van der Linden, Amar Soebhag, and Pim van Vliet, authors of the October 2024 paper “Leveraging the Low-Volatility Effect,” suggested that the performance of the low volatility factor could be improved by integrating the momentum and value (using net-payout yield) factors into an active low-volatility portfolio. Their intuition was to prevent purchasing low volatility stocks that have been selling off recently or that are expensive. Their data sample covered the period 1990-2023. They examined five strategies.
Case 1. Enhancing Low Volatility with Return Factors
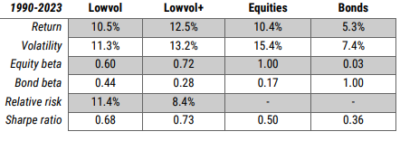
Their standard low-volatility strategy (Lowvol) selected the 100 stocks with the lowest three-year volatility from the largest 1,000 US stocks and rebalanced monthly. Their enhanced strategy (Lowvol+) involves two steps. It filters the opportunity set by selecting the 500 lowest volatility stocks from the index of 1,000 and then selecting the top 100 stocks with the highest combined net payout yield (cheapest) and 12-1-month price momentum within those 500 low-volatility stocks. The following table makes the case for an integrated strategy as returns increased, the Sharpe ratio improved, bond risk decreased, and relative risk (the volatility of the relative performance against the equity market portfolio) decreased. Although absolute risk and beta rose somewhat, they remained below benchmark levels, preserving the strategy’s defensive characteristics.
The results are hypothetical results and are NOT an indicator of future results and do NOT represent returns that any investor actually attained. Indexes are unmanaged and do not reflect management or trading fees, and one cannot invest directly in an index.
Second Case: Lower Equity and Bond Allocation, Add Lowvol+
The table below presents the statistics of three portfolio combinations, starting with a traditional 60/40 equity/bond strategic asset allocation. In the first, 15% is allocated to LowVol+ equities by replacing 10% equities and 5% bonds. The second applies an equal 1/N allocation across all three assets. The third invests 70% in LowVol+ equities and 30% in bonds.

The results are hypothetical results and are NOT an indicator of future results and do NOT represent returns that any investor actually attained. Indexes are unmanaged and do not reflect management or trading fees, and one cannot invest directly in an index.
In all cases, portfolio volatility remained around 9.5%, while returns increased with higher allocations to LowVol+ equities. As a result, the Sharpe ratio improved consistently, rising from 0.64 to 0.70, 0.75, and 0.82.
Third Case: Using Leverage to Increase Returns
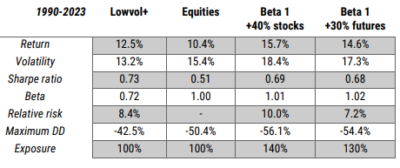
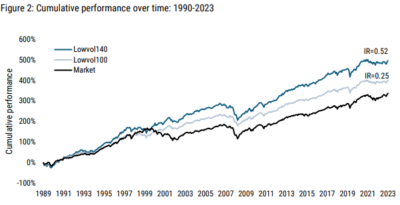
Some investors may prioritize increasing total returns over reducing risk, aiming to outperform a benchmark. A way to achieve this is by leveraging the Lowvol+ strategy to match market risk with a beta of 1. To achieve a beta-1 strategy, they took a 140% long position in low-volatility stocks, financed by borrowing 40% (costs were accounted for). They also used equity market index futures to achieve a beta-1 strategy—this approach requires less leverage (30%), incurring lower costs. The table below shows the results. In each case the Sharpe ratio increased, though volatility increased as well.
The results are hypothetical results and are NOT an indicator of future results and do NOT represent returns that any investor actually attained. Indexes are unmanaged and do not reflect management or trading fees, and one cannot invest directly in an index.
Fourth Case: Absolute Returns
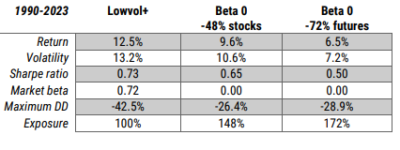
They considered an investor seeking a return profile that is, on average, positive and independent of the general equity market—targeting a long-term beta of 0—as often pursued by alternative risk premia strategies and hedge funds. This can be achieved by shorting the market using index futures, or by taking short positions in individual high volatility, weak net payout yield, and poor 12-1-month momentum (speculative) stocks. Shorting individual stocks, particularly small caps, can be costly, so their analysis used the largest 1,000 U.S. stocks which are liquid and can be efficiently shorted. The table below shows the results for the Beta 0 strategy that is 148% long Lowvol+ and short 48% speculative stocks (only 48% shorting is needed to achieve a Beta 0 because of the higher beta/volatility of the speculative stocks) and the Beta 0 strategy that is 100% long Lowvol+ and short 72% futures.
The results are hypothetical results and are NOT an indicator of future results and do NOT represent returns that any investor actually attained. Indexes are unmanaged and do not reflect management or trading fees, and one cannot invest directly in an index.
Note that in Case Three we saw that the equity portfolio returned 10.4%, its Sharpe ratio was 0.51, and the maximum drawdown was -50.4%. The two Beta 0 strategies compare favorably, producing lower volatility and much lower maximum drawdowns, though achieving lower returns.
Fifth Case: Downside Protection
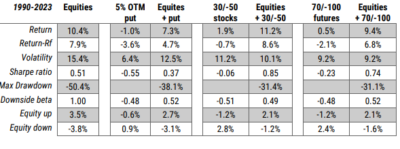
The last case moved beyond zero beta to a negative market beta—the strategy should generate positive returns when equity market returns are negative. To achieve a negative beta, they used 5% out-of-the money puts which achieved a beta of about -0.5 (negative exposure to beta, providing downside protection). Then, targeting a beta of -0.5 and using the low-volatility anomaly, they constructed a portfolio:
- With a 30% long position in low-volatility stocks combined with a -50% short position in speculative stocks (the high volatility stocks).
- With a 70% long position in low-volatility stocks combined with a -100% short position in equity futures.
They also then combined these two portfolios with a 100% equities portfolio. The table below presents the results.
The results are hypothetical results and are NOT an indicator of future results and do NOT represent returns that any investor actually attained. Indexes are unmanaged and do not reflect management or trading fees, and one cannot invest directly in an index.
As expected, they found that buying put options was costly, producing an excess return of -3.6%. When combined with equities, the total return was 7.3%, a cost of 3.1% (10.4-7.3) per annum for downside protection, lowering the Sharpe ratio to 0.37. The other two strategies led to improved downside protection, lower volatility, and higher Sharpe ratios.
Their findings led van der Linden, Soebhag, and van Vliet to conclude: “Among the strategies discussed, the first case—enhancing low-volatility portfolios with momentum and value factors—emerges as a highly effective solution. It boosts returns, reduces risk, and improves overall performance with minimal downside, making it especially appealing for investors constrained by leverage or benchmarks. The other strategies can be tailored to suit varying risk appetites and objectives, providing flexibility for both benchmark-constrained and unconstrained investors. The choice depends on individual preferences for risk and return and investment constraints. In all cases, the low-volatility anomaly remains a valuable inefficiency, offering significant benefits in risk reduction and long-term return enhancement.”
Supporting Evidence
Robeco’s David Blitz, Clint Howard, Danny Huang, and Maarten Jansen, authors of the November 2024 study “Low-Risk Alpha Without Low Beta,” constructed base-case low-risk portfolios which produced an ex-post beta of approximately 0.7 to the broad market. They then incorporated value, momentum, and quality characteristics alongside low volatility and applied a moderate amount of leverage (up to
40%) to these portfolios to increase their market beta to 1.0. They also used a risk model to control the ex-ante tracking error of the leveraged low-risk portfolios relative to the market. The value, quality, and momentum factors were represented by net payout yield, gross profitability to assets, and 12-1m price momentum, respectively. Their 40% leverage consisted of synthetic positions (futures) involving financing costs equal to the risk-free rate. For developed markets their data sample spanned the period 1986-2023. For emerging markets, it spanned December 1995-December 2023. Their findings were consistent with those of van der Linden, Soebhag, and van Vliet.
- The information ratio (a portfolio returns beyond the returns of a benchmark, usually an index, compared to the volatility of those returns) of a leveraged risk-controlled low-risk strategy increased from 0.43 (no leverage, no risk control) to 0.92. This increase came from both an increase in outperformance relative to the benchmark (3.32% to 5.92%) and a decrease in ex-post tracking error (7.75% to 6.43%).
- The increase in IR came at the cost of a slightly lower Sharpe ratio (0.72 to 0.67).
- The maximum benchmark-relative drawdown fell from 22% to 12% for the leveraged risk-controlled low-risk strategy.
- The outperformance was robust across time periods and markets and was not explained by exposure to common equity risk factors such as size, value, quality, and momentum.
Their findings led the authors to conclude: “Taken together, these results show how the combination of leverage and tracking error control provides access to the alpha of low-risk stocks without the low-beta tilt of traditional lowrisk strategies. In other words, our approach transforms a defensive equity strategy that excels at capital preservation into a portfolio with market-like risk characteristics but a high expected outperformance.” They added that their “results support the hypothesis that leverage constraints play a role in the persistence of the low-volatility anomaly.” They also noted: “The costs required to use leverage will be a determinant of the added benefits that can be enjoyed from following such a strategy. Nevertheless, if an investor is able to accept leverage in the portfolio, our results show that this allows access to the low-volatility anomaly without sacrificing participation in bull markets.”
Low Volatility ETF Performance
Before concluding we can examine the returns of the low volatility funds SPLV and XRLV, and that of the Vanguard S&P 500 ETF (VOO). The period is May 2015-October 2024.
| Fund | SPLV | XRLV | VOO |
| Annual Return (%) | 9.5 | 10.9 | 14.3 |
| Standard Deviation (%) | 12.7 | 14.0 | 15.5 |
| Sharpe Ratio | 0.63 | 0.67 | 0.82 |
| Maximum Drawdown (%) | -21.4 | -23.8 | -23.9 |
The results are hypothetical results and are NOT an indicator of future results and do NOT represent returns that any investor actually attained. Indexes are unmanaged and do not reflect management or trading fees, and one cannot invest directly in an index.
The two low volatility strategies did achieve their objective of lower volatility—past low volatility predicted future low volatility. However, it came at the cost of not only lower returns, but lower risk-adjusted returns. With that said, it is important to note that this was an exceptionally strong period for the S&P 500, with only two negative years (2018 and 2022) and only one year with a double-digit loss (2022). Another important note is that surprisingly, the maximum drawdowns of the two low volatility funds were not that much lower than that of VOO, and in the case of XRLV, it was virtually identical. On the other hand it is worth pointing out that in 2022, when the SPDR® Portfolio Long Term Treasury ETF (SPTL) returned -29.5%, despite positive exposure to the term premium, XRLV (SPLV) lost just 4.8% (4.9%). And this was a year when VOO lost 18.2%. One last note, the US situation over this period was heavily influenced by the outperformance of the FANG/MAG7 stocks.
Investor Takeaway
The low-beta anomaly was documented more than 50 years ago. It has been persistent and pervasive around the globe and across asset classes. However, newer research demonstrates not only that returns to the anomaly are well explained by exposure to what are now considered other common factors, but also that the premium is dependent on whether low volatility is in the value or growth regime. Unfortunately for investors in low-volatility strategies, the popularity of the strategy has caused valuations to leave the value regime where they had historically generated alphas.
The bottom line is that returns to the low volatility anomaly have only justified investing when low-volatility stocks were in the value regime, after periods of strong market performance, and when they excluded high-volatility stocks that have low short interest (providing clues as to how to improve its performance). This may be why live funds have been generating large negative alphas once we account for common factor exposures.
Finally, Van der Linden, Soebhag, and van Vliet showed that low volatility strategies can be enhanced by also screening for the value and momentum factors. Unfortunately for US investors, while Robeco does offer these funds in the form of UCITS (Undertakings for Collective Investment in Transferable Securities) in Europe, Latin/South America, Asia, and Canada, in the US they only offer them in segregated accounts. I’m not aware of any US mutual funds or ETFs that currently incorporate this improvement. Stay tuned.
Larry Swedroe is the author or co-author of 18 books on investing, including his latest Enrich Your Future.
About the Author: Larry Swedroe
—
Important Disclosures
For informational and educational purposes only and should not be construed as specific investment, accounting, legal, or tax advice. Certain information is deemed to be reliable, but its accuracy and completeness cannot be guaranteed. Third party information may become outdated or otherwise superseded without notice. Neither the Securities and Exchange Commission (SEC) nor any other federal or state agency has approved, determined the accuracy, or confirmed the adequacy of this article.
The views and opinions expressed herein are those of the author and do not necessarily reflect the views of Alpha Architect, its affiliates or its employees. Our full disclosures are available here. Definitions of common statistics used in our analysis are available here (towards the bottom).
Join thousands of other readers and subscribe to our blog.

