Momentum is a financial anomaly in which buying stocks with positive past returns and selling the negative yielding ones has delivered positive returns. After Jegadeesh and Titman (1993)’s seminal paper “Returns to Buying Winners and Selling Losers: Implications for Stock Market Efficiency” was released, empirical research has identified various forms of momentum profits over the years (demonstrating robustness of the factor), including industry momentum where excess returns are generated from past price movements as investors insufficiently account for industry-wide shocks. While various specifications of industry momentum portfolios exist, researchers employ standard Industry Classification Schemes (ICS) such as Standard Industry Classification (SIC) and North American Industry Classification System (NAICS), the main benefit of constructing industry momentum portfolios based on standard ICS is that it is straightforward and reproducible. However, that benefit may come at the cost of accuracy and oversimplification of complex industry relationships between companies.
To address that issue, and hopefully better incorporate complex industry relationships, Joon Chul James Ahn, Dragos Gorduza, and Seonho Park, authors of the study “Hidden Neighbours: Extracting Industry Momentum From Stock Networks,” published in the October 2024 issue of Financial Markets and Portfolio Management, employed interdisciplinary methods, merging network analysis and Natural Language Processing (NLP) techniques for portfolio construction.
Utilizing advanced text embedding models, they enhanced portfolio construction by integrating textual insights from corporate disclosures (10-k and 10-Q filings) into stock networks. To tackle NLP tasks in the financial domain they used FinBERT (a language model based on BERT, a Bidirectional Encoder Representations from Transformers) that is pretrained on corporate disclosure and financial text data, making it suitable for use in financial applications. Using FinBERT allowed for the creation of more complex document vector embedding that can better account for nuanced similarities between corporate disclosures from different companies.
Their industry momentum portfolio was constructed in the following manner. They first defined momentum stocks as stocks with top 30th percentile total returns in the past 12 − 1 months, with 1 month skipping in the look-back period. Next, they ranked each node in the combined network by the average of edge weights (a numerical value assigned to an edge in a graph, representing the distance associated with traversing that edge; a concept crucial when analyzing graphs for optimization problems), connected to momentum stocks (i.e. the highest rank is assigned to nodes with the highest average combined network edge weights with momentum stocks). The graphs below from their paper illustrates the concept.
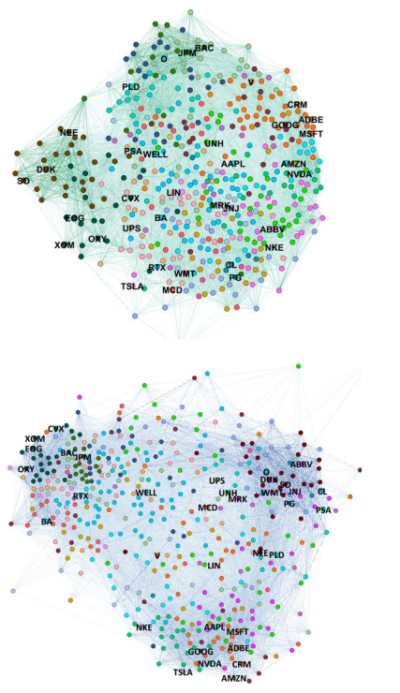
They then selected the top 50 stocks among this ranked list to be included in their portfolio on an equal-weighted basis and held them for 12 months. They named this industry momentum portfolio the “Hidden Neighbours” portfolio, because it sought to choose stocks that had strong business similarity yet with low stock price correlation with momentum stocks. To gauge the relative performance of the Hidden Neighbours portfolio they compared its performance against three benchmarks:
- Standard Momentum computed by selecting the top 50 stocks in the S&P500 with the highest total returns, with a 6 − 1 look-back period, holding the portfolio for 6 months, resulting in J = 6, K = 6 equal-weighted momentum portfolio with 1 month skipping.
- SIC Industry Momentum computed by identifying momentum stocks as stocks with top 30th percentile total returns. Then, industry momentum was extracted using the first two digits of a company’s SIC code, which appear among the momentum stocks. All S&P 500 companies with the respective momentum-experiencing SIC codes were selected. They then equally weighted the top 50 stocks with the highest total return in a 6 − 1 look-back period. The holding period was set to 6 months.
- S&P 500 Index: The total return of the S&P 500 index.
Their data sample covered the period 2013-2022. Following is a summary of their key findings:
- The two networks (price-based and text-based) captured different aspects of company relationships.
- Combining the two networks exploited less visible industry momentum—each network provided exclusive characteristics that the other did not have.
- Using both networks simultaneously enabled the construction of a combined network that identified peers that have strong business similarity yet have low stock price correlation.
- Their “Hidden Neighbours” portfolio delivered an annualized return of 18.16% with a Sharpe ratio of 0.85, outperforming the S&P 500 and other traditional momentum strategies.
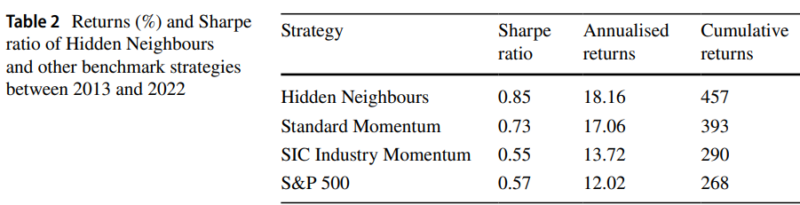
The results are hypothetical results and are NOT an indicator of future results and do NOT represent returns that any investor actually attained. Indexes are unmanaged and do not reflect management or trading fees, and one cannot invest directly in an index.
- Factor decomposition attributed returns primarily to an idiosyncratic factor α. The table below shows a statistically significant alpha at the 5% confidence level.
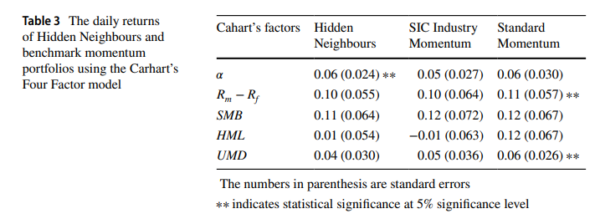
The results are hypothetical results and are NOT an indicator of future results and do NOT represent returns that any investor actually attained. Indexes are unmanaged and do not reflect management or trading fees, and one cannot invest directly in an index.
- The Hidden Neighbours portfolio was robust to erosion of returns from trading costs. While the benchmark momentum strategies are rebalanced every 6 months, the Hidden Neighbours portfolio is rebalanced every 12 months. Furthermore, the Hidden Neighbours portfolio showed low annual median portfolio turnover of 38%, significantly lower than the SIC Industry Momentum benchmark with 75% median annual turnover, and lower than other momentum strategies which have turnover closer to 100%.
- The maximum drawdown of Hidden Neighbours was like that of the S&P 500 and other benchmark strategies.
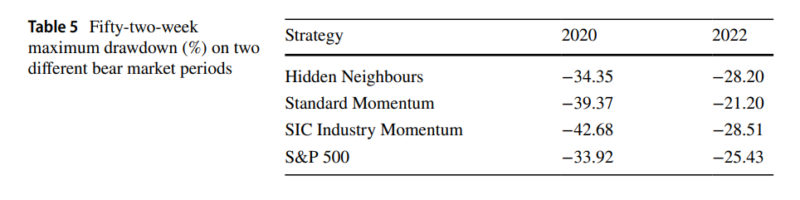
The results are hypothetical results and are NOT an indicator of future results and do NOT represent returns that any investor actually attained. Indexes are unmanaged and do not reflect management or trading fees, and one cannot invest directly in an index.
As an example of the benefit of combining the two networks they used Berkshire Hathaway, an insurance conglomerate that owns companies across numerous sectors. While the peers generated from standard ICS methodologies revolved around Berkshire Hathaway’s core GEICO insurance business, the Combined Network was better able to account for the conglomerate’s non-core businesses, spanning across railroad, healthcare, food & beverage, etc., leading to the discovery of peers closer to Berkshire Hathaway’s non-insurance periphery businesses
Their findings led Ahn, Gorduza, and Park to conclude:
“We believe the excess returns of the Hidden Neighbours portfolio stem from the identification of industry momentum between insufficiently priced-in peer companies.”
Before drawing any conclusions, note that the period covered by the authors was only 10 years, which is curious given the data is certainly available for longer periods. With that said, despite the short period, the alpha was statistically significant at the 5% confidence level. It’s also worth noting their choice of a benchmark of six months versus their own choice of 12 months. They certainly could have used 12 months for both in order to make the comparison more apples-to-apples.
Investor Takeaways
There is no doubt that artificial intelligence (AI) is changing the way academics and financial institutions construct portfolios and trade. The findings from the research (see here, here, and here) demonstrated that AI is a powerful tool that has the potential to improve outcomes. With that said, the collective wisdom of the market is also a powerful force that ensures that the price quoted is the best estimate of the value of a security given its risk. However, we also know that market anomalies can persist (even after publication of research findings, though they do tend to shrink) because of limits to arbitrage and the risks and costs of shorting. Momentum is one of the anomalies that has persisted for more than 30 years since the publication of the Jagadesh and Titman paper.
Finally, investors should be skeptical of AI results because while AI will give you an answer, it may be difficult to determine whether the answer is correct or not. How can one verify that what it is saying is correct/reasonable? Thus, it is important to understand why AI is giving a specific answer. This is why in our book “Your Complete Guide to Factor-Based Investing” Andrew Berkin and I made one of the six requirements for considering investing in a factor was that there had to be an intuitive risk- or behavioral explanation for why a premium should persist. Investors should be wary of any black box. Another area of concern is the potential for look-ahead bias. The latest versions of AI are trained on material through the end of 2023 or some similar date. When using AI in a backtest, how do we know if the relationships come from true insights or from simply knowing the answer based on already knowing the future?
Larry Swedroe is the author or co-author of 18 books on investing, including his latest Enrich Your Future.

About the Author: Larry Swedroe
—
Important Disclosures
For informational and educational purposes only and should not be construed as specific investment, accounting, legal, or tax advice. Certain information is deemed to be reliable, but its accuracy and completeness cannot be guaranteed. Third party information may become outdated or otherwise superseded without notice. Neither the Securities and Exchange Commission (SEC) nor any other federal or state agency has approved, determined the accuracy, or confirmed the adequacy of this article.
The views and opinions expressed herein are those of the author and do not necessarily reflect the views of Alpha Architect, its affiliates or its employees. Our full disclosures are available here. Definitions of common statistics used in our analysis are available here (towards the bottom).
Join thousands of other readers and subscribe to our blog.