Robert J. Shiller, an American academic, made waves in the economic community when he correctly anticipated the sharp decline in equities in 2000 in his book “Irrational Exuberance.” In the book, one of Shiller’s basic tools for thinking about equity values is the market’s cyclically adjusted P/E ratio. We wanted to take a look at Shiller’s famous ratio today, with the hope that it might assist us in assessing current market conditions. We will walk through Turnkey’s calculation of Shiller’s famous ratio, review how we present it on our site, and then see what kind of signals it is sending us today.
How is the ratio calculated?
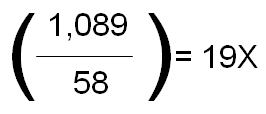
The first step in calculating the cyclically adjusted P/E is to determine the nominator, which is the real price of equity markets. For example, on 9/30/11, the S&P closed at a nominal value of 1,131. In our model, we express all values in terms of 2010 dollars (10/31/10), so we take today’s nominal S&P value of 1,131, and adjust it for inflation. The CPI was 218.7 on 10/31/10, but on 9/31/11 it stood at 227.2. Therefore in real terms, the S&P is at 1,089:

We can then use this methodology to calculate a real S&P close for every month going back to 1/31/1871.
The next step in calculating the cyclically adjusted P/E is to determine the denominator. First, we look at nominal earnings figures for the S&P. While the numbers have not been finalized, S&P currently estimates that on 9/30/11 the index’s trailing twelve months earnings per share for the overall S&P index were $88. That is to say, if you owned today’s index at $1,131, the earnings associated with that equity ownership interest would equate to $88, for a twelve month trailing nominal P/E of 12.9x earnings. You can go back in time and, for any given month in the history of the S&P, determine the trailing 12-months earnings figure for the overall index. Now we adjust these figures for inflation, using the same methodology discussed above. So for example, for 9/30/11, we see the real earning for the S&P are:
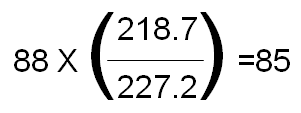
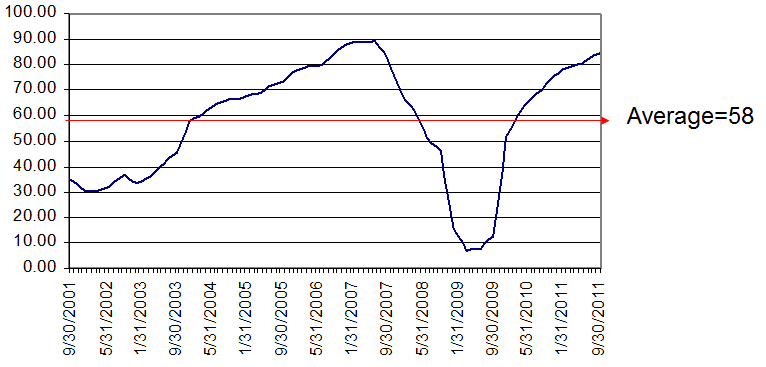
We can look at a stream of such monthly figures, each representing the 12-month trailing average real earnings for the S&P. Below is a graph showing this calculation for each month over the past 10 years:
The results are hypothetical results and are NOT an indicator of future results and do NOT represent returns that any investor actually attained. Indexes are unmanaged, do not reflect management or trading fees, and one cannot invest directly in an index. Additional information regarding the construction of these results is available upon request.
Note that the average is $58. This is the “cyclical adjustment” in the calculation, which normalizes the gyrations in earnings figures apparent in the graph above. It is saying that, on average, the market has had real earnings of 58 per year in each of the past ten years.
Now we can see that the cyclically adjusted real P/E for the market is about 19:
How we think about Shiller’s Ratio
We hate to admit it, but bond folks are typically smarter than their equity counterparts. We may never reach their IQ level, but we can always borrow their ideas.
Here at Turnkey Analyst we prefer to look at earnings yield, or the reciprocal of the P/E, because it allows a more direct comparison with yields in other asset classes (real estate, fixed income, CDs, etc.). Looking at yields is also a more intuitive way of thinking about what you get when you purchase an asset. For example, I buy a popsicle stand at a 12% yield; I get 12$ for every $100 I invest. Whereas, “I buy a popsicle stand for a P/E of 8.33x” is less intuitive. Especially when I have to compare the popsicle stand to the treasury bonds paying a 5% yield.
12% vs. 5%. Got it. 8.33x compared to 5%? What the heck is that supposed to mean? Anyway, I digress…
How we create a predicted 10-year return figure
Taking the reciprocal of the cyclically adjusted real P/E, above, we get a yield of 5.28%. Next, we go back and calculate a cyclically adjusted real yield for the market, using the methodology outlined above, for every month when 10 years of trailing data was available, which turns out to be back to 1/31/1881.
Then we added one more piece of data. On the date of each calculation, we asked “what was the real return of the S&P, per year, over the subsequent 10 year period?” This is an geometric average calculation. The latest period for which we know the full 10-year real return subsequent to an observation of the cyclically adjusted real yield of the market is 9/30/01. On that date, the S&P closed at 1,281 in real terms, and as we know on 9/30/11, the S&P closed at 1,089 in real terms. So in the equation below, we want to solve for r.

So we divide both sides by 1,281, take the 10th root of both sides, and subtract 1 from both sides:

We can see that the average yearly real return of the S&P from 9/30/01 to 9/30/11 was -1.6%. Now we have two variables: 1) the cyclically adjusted real yield for any given point in time, and 2) the subsequent 10 year real returns from that date.
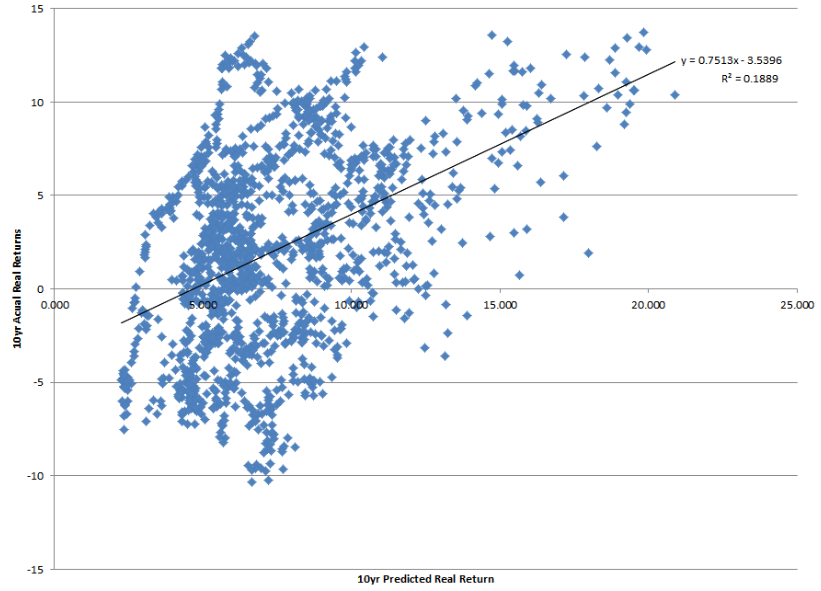
Now we want to see in what way the first variable is predictive of the second variable, so we run a regression on these two variables, using input from every year data is available (from 1/31/1881 through 9/30/2001), and solve for an intercept, A, and a slope, B, in the regression equation (Y) = A + BX. Below is the output for the regression:
The results are hypothetical results and are NOT an indicator of future results and do NOT represent returns that any investor actually attained. Indexes are unmanaged, do not reflect management or trading fees, and one cannot invest directly in an index. Additional information regarding the construction of these results is available upon request.
The regression returns an intercept value of A=-3.54, and a slope coefficient of B=0.75. This means that for every 1.0 percentage point move in cyclically adjusted real yield, we see, on average, a 75bp move in predicted real S&P returns over the subsequent 10-year period.
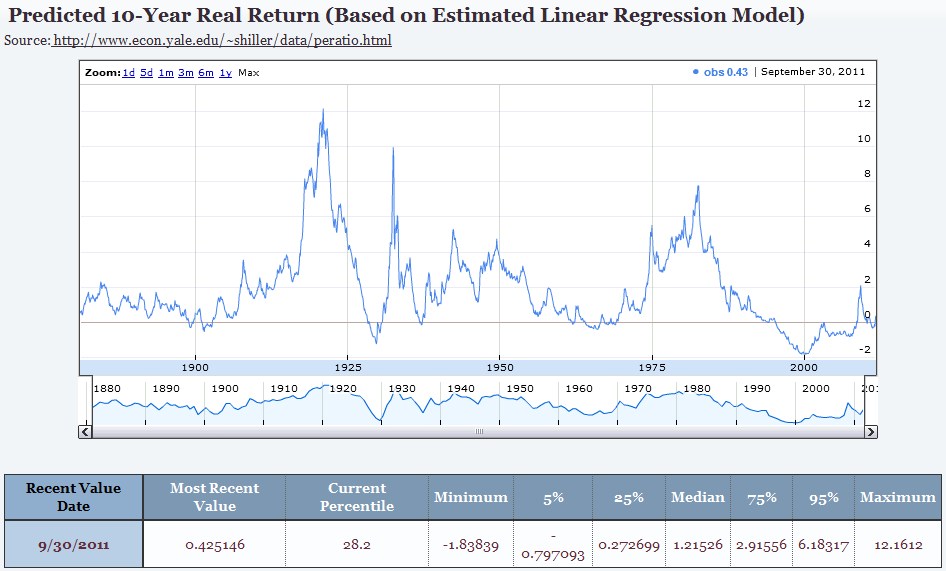
Now we are ready to take the final step and see what the regression model predicts for the S&P for the next 10 years. Recall that we have already calculated the current (9/31/11) cyclically adjusted real yield for the S&P above, and came up with 5.28%. Now we take: Y = -3.54 + 0.75 * 5.28, and solve for Y. In this case, Y = 0.43 (or if you take the regression inputs out several decimal places, 0.425146). This suggests that, based on our regression model, the stock market will see real returns of 0.4% per year for the next 10 years. Kind of makes TIPS look a little more appealing, no?
The results are hypothetical results and are NOT an indicator of future results and do NOT represent returns that any investor actually attained. Indexes are unmanaged, do not reflect management or trading fees, and one cannot invest directly in an index. Additional information regarding the construction of these results is available upon request.
Reviewing the data above, in our Predicted 10-Year Real Return (Based on Estimated Linear Regression Model) screen, we can see the Most Recent Value of 0.425146, as discussed above. This predicted return falls in the 28.2%ile of the predicted universe. You can also see minimum, median, and maximum predicted values, as well as several %ile breakpoints, for comparative purposes.
At the end of the day, the current cyclically adjust real yield of 5.28% is telling us that the stock market is expensive, at least by historical standards. This yield falls in the lower third of predicted states for the market’s value. So it’s possible that the stock market is not an especially good place to invest your money, at least at today’s prices.
Sure the predicted market returns sucks, but investing is about opportunity costs, right?
Investing, and life, are all about opportunity costs. Sure, we all want a college degree, but what if we spend 4 years getting a degree in basket-weaving, end up with $200,000 in debt, and can’t get a job? Perhaps going to work at the local lumber mill at $15/hr was a better choice? Who knows. Similarly, we all want 20% inflation-adjusted CAGR on our stock market investments, but what if the market is only offering up 43bp? Well, maybe that isn’t that bad if bonds are offering up -5% inflation-adjusted CAGR?
We’ve got a tool to help you address these concerns. One of the metrics we like to look at is the inflation-adjusted spread between the 10-year earnings yield of the stock market compared to the 10-year Treasury Bond yield. Currently, the inflation-adjusted 10-year earnings yield sits at 5.276% (previously discussed above) and the nominal 10-year treasury bond (as of 9/30/2011) sits at 1.98%. To adjust the nominal 10-year bond into real terms we simply take [(1+1.98%)/(1+CPI%)]-1. The 1-year CPI change from 9/30/2010 to 9/30/2011 was 3.99%, which implies the real bond yield is -1.94%. Putting this information all together, we identify that the real spread between earnings yield and bond yields is 7.21%, which is actually the 71%ile based on history.

The results are hypothetical results and are NOT an indicator of future results and do NOT represent returns that any investor actually attained. Indexes are unmanaged, do not reflect management or trading fees, and one cannot invest directly in an index. Additional information regarding the construction of these results is available upon request.
Conclusions
1) We’ve identified that predicted real stock returns are projected to be 43bp a year for the next 10 years according to a very simple linear regression model. STOCKS SEEM EXPENSIVE
2) We’ve also identified that relative to bonds, the real spread between stocks and bonds is 7.2% in terms of yields. STOCKS RELATIVE TO BONDS SEEM CHEAP.
3) So if stocks are expensive, and stocks relative to bonds seem cheap, this implies that bonds are also expensive. EVERYTHING IS EXPENSIVE!
4) The Fed is accomplishing their desired mission: keep interest rates low and force people into overpriced risky assets.
About the Author: David Foulke
—
Important Disclosures
For informational and educational purposes only and should not be construed as specific investment, accounting, legal, or tax advice. Certain information is deemed to be reliable, but its accuracy and completeness cannot be guaranteed. Third party information may become outdated or otherwise superseded without notice. Neither the Securities and Exchange Commission (SEC) nor any other federal or state agency has approved, determined the accuracy, or confirmed the adequacy of this article.
The views and opinions expressed herein are those of the author and do not necessarily reflect the views of Alpha Architect, its affiliates or its employees. Our full disclosures are available here. Definitions of common statistics used in our analysis are available here (towards the bottom).
Join thousands of other readers and subscribe to our blog.

