This article explains how researchers studied small investors’ trading habits by looking at tiny price differences, called subpennies, in stock trades. They found that the current method to identify these trades isn’t very accurate. By using a new approach, they improved the accuracy, helping to better understand how small investors buy and sell stocks.
A (Sub)penny for Your Thoughts: Tracking Retail Investor Activity in TAQ
- Brad M. Barber, Xing Huang, Philippe Jorion, Terrance Odean, and Christopher Schwarz
- Journal of Finance, 2024
- A version of this paper can be found here
- Want to read our summaries of academic finance papers? Check out our Academic Research Insight category
Key Academic Insights
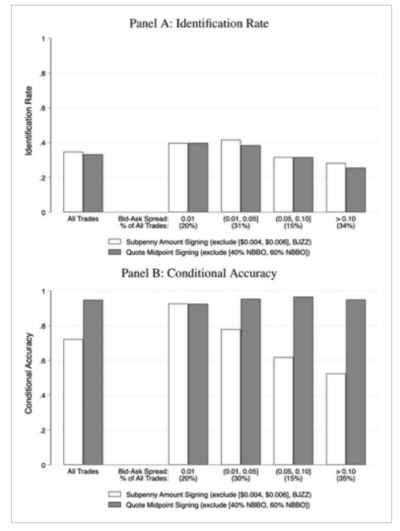
Current Method’s Limitations: The existing method correctly identifies only 35% of small investor trades and often mislabels them as buys or sells.
Improved Accuracy: By using the midpoint of the bid-ask spread to determine trade direction, the accuracy improved significantly, reducing errors to 5%.
Consistent Measurements: The new method provides reliable data on small investor trading patterns across all stocks.
Practical Applications for Investment Advisors
Better Understanding of Client Behavior: Accurate tracking of small investor trades helps advisors understand their clients’ trading habits and preferences. We previously explored what retail investors actually do with their trades, revealing important behavioral insights from real data.
Enhanced Market Analysis: Improved data allows advisors to analyze market trends influenced by small investors, aiding in more informed decision-making. A deeper look at how retail investor sentiment influences markets can be found in this blog.
How to Explain This to Clients
“By using better methods to track how small investors like you trade, we can gain clearer insights into market trends and behaviors. This helps us provide advice that’s more tailored to your needs and the current market conditions.“
The Most Important Chart from the Paper
This table visually demonstrates the accuracy of different methods used to identify and categorize retail investor trades. Specifically, it compares the original algorithm’s performance with the modified approach that uses the midpoint of the bid-ask spread to determine trade direction. The figure highlights that the original method correctly identifies only 35% of retail trades and often mislabels them as buys or sells, while the modified approach significantly improves accuracy, reducing errors to 5%. This visual evidence underscores the effectiveness of the new method in accurately tracking retail investor activity, which is crucial for understanding market dynamics and making informed investment decisions.
The results are hypothetical results and are NOT an indicator of future results and do NOT represent returns that any investor actually attained. Indexes are unmanaged and do not reflect management or trading fees, and one cannot invest directly in an index.
Abstract
We placed 85,000 retail trades in six retail brokerage accounts from December 2021 to June 2022 to validate the Boehmer et al. algorithm, which uses subpenny trade prices to identify and sign retail trades. The algorithm identifies 35% of our trades as retail, incorrectly signs 28% of identified trades, and yields uninformative order imbalance measures for 30% of stocks. We modify the algorithm by signing trades using the quoted spread midpoints. The quote midpoint method does not affect identification rates but reduces the signing error rates to 5% and provides informative order imbalance measures for all stocks.

About the Author: Elisabetta Basilico, PhD, CFA
—
Important Disclosures
For informational and educational purposes only and should not be construed as specific investment, accounting, legal, or tax advice. Certain information is deemed to be reliable, but its accuracy and completeness cannot be guaranteed. Third party information may become outdated or otherwise superseded without notice. Neither the Securities and Exchange Commission (SEC) nor any other federal or state agency has approved, determined the accuracy, or confirmed the adequacy of this article.
The views and opinions expressed herein are those of the author and do not necessarily reflect the views of Alpha Architect, its affiliates or its employees. Our full disclosures are available here. Definitions of common statistics used in our analysis are available here (towards the bottom).
Join thousands of other readers and subscribe to our blog.