The CAPM is prolific, but doesn’t appear to work! In this blog, we discuss our views on how to use the Fama French model.
(Note: see here for our epic post on the history of factor investing.)
Does the CAPM actually work?
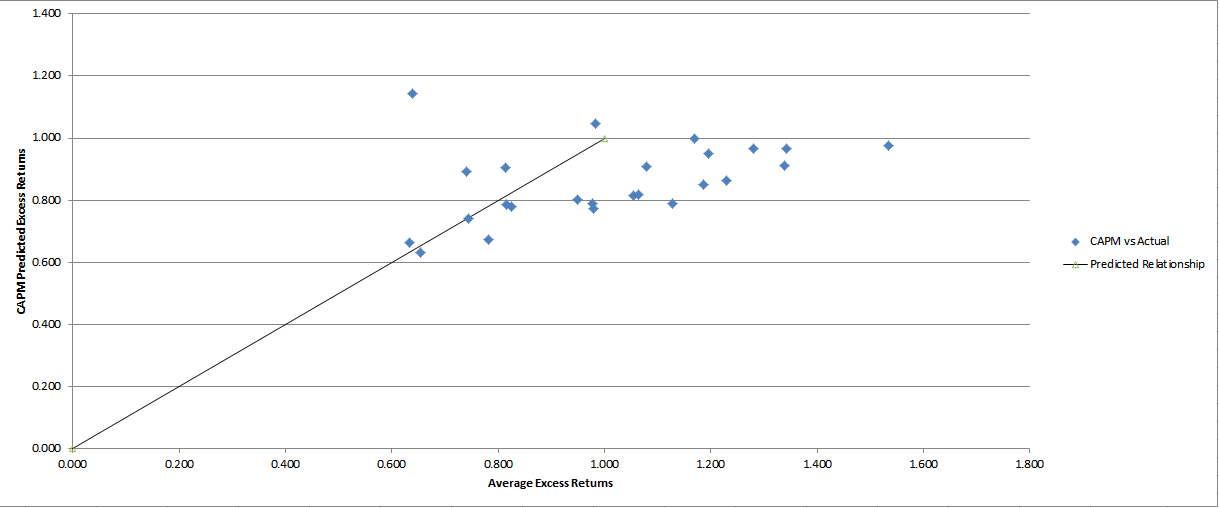
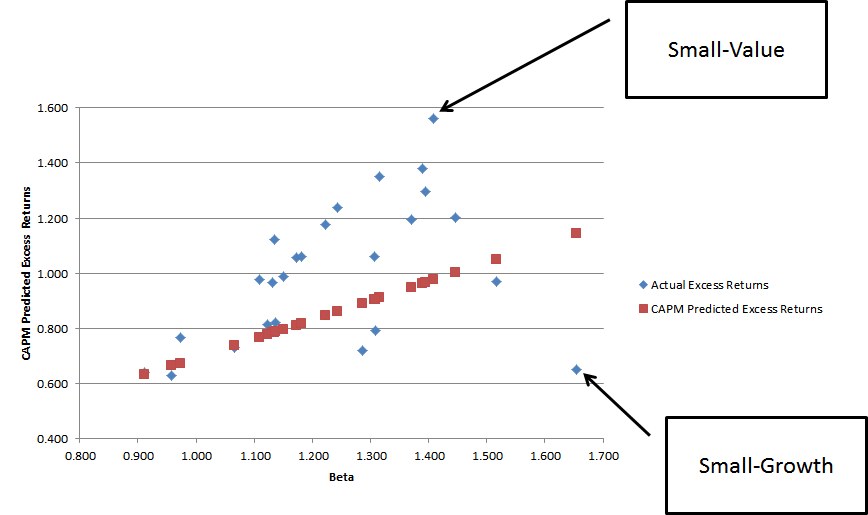
In the figures below I’ve plotted the Fama-French 25 (portfolios ranked on size and book-to-market) against beta.
In the first figure, I plot the average excess return to the FF 25 against the average excess return one would expect, given beta.

The results are hypothetical results and are NOT an indicator of future results and do NOT represent returns that any investor actually attained. Indexes are unmanaged, do not reflect management or trading fees, and one cannot invest directly in an index. Additional information regarding the construction of these results is available upon request.
Sure doesn’t look like the CAPM does a very good job: empirically observed excess returns have no visible relationship to their CAPM predicted excess returns.
Next, I plot the actual excess returns and CAPM expected excess returns against estimated betas for the FF 25:

The results are hypothetical results and are NOT an indicator of future results and do NOT represent returns that any investor actually attained. Indexes are unmanaged, do not reflect management or trading fees, and one cannot invest directly in an index. Additional information regarding the construction of these results is available upon request.
Again, the CAPM doesn’t do a good job of explaining returns. Moreover, closer inspection indicates that the small-value and the small-growth portfolios are really out of wack.
If you’d like to see how I calculated the charts above, please reference the excel file.
Given such a poor track record, is anyone still using the CAPM?
Lots of people, apparently…
Welch (2008) finds that ~75% of professors recommend the use of the model when estimating the cost of capital, and Graham and Harvey (2001) find that ~74% of CFOs use the CAPM in their work.
A few quotes from Graham and Harvey 2001 sum up common sentiment regarding the CAPM:
“While the CAPM is popular, we show later that it is not clear that the model is applied properly in practice. Of course, even if it is applied properly, it is not clear that the CAPM is a very good model [see Fama and French (1992)].”…practitioners might not apply the CAPM or NPV rule correctly. It is also interesting that CFOs pay very little attentionto risk factors based on momentum and book-to-market-value.”
Of course, there are lots of arguments to consider before throwing out the CAPM. Here are a few:
- Everyone learns about it and knows how to use it (although, Graham and Harvey suggest that many practitioners don’t even apply the CAPM theory correctly)
- Data is easy to obtain on betas.
- Roll’s critique–maybe the CAPM isn’t a junk theory, rather, the empirical tests showing the CAPM doesn’t work are bogus.
Regardless, being that this blog is dedicated to empirical data and evidence, and not about ‘mentally masturbating about theoretical finance models,’ we’ll operate under the assumption that the CAPM is dead until new data comes available.
The Fama French 3-Factor Alternative?
Given the CAPM doesn’t work that well in practice, perhaps we should look into how to use the Fama French model (which isn’t perfect or cutting edge, but a solid workhorse nonetheless). And while the FF model inputs are highly controversial, one thing is clear: the FF 3-factor model does a great job explaining the variability of returns. For example, according to Fama French 1993, the 3-factor model explains over 90% of the variability in returns, whereas the CAPM can only explain ~70%!
The 3-factor model is great, but how the heck does one estimate the FF factors?
Dartmouth Professor Ken French comes in for the rescue!
Prof. Ken French houses one of the richest data resources on the web–I like to call it “MSCI Barra for broke people.” Here’s the link to his factor research. We have our own factor data library that you may access as well.
The Fama and French 3-factor Model
First, here are the links to the 3-factor model source documents if you enjoy reading archaic academic finance journals: Fama French 1992 and Fama French 1993.
I also recommend reading the CAPM chapter from Ivo Welch’s finance book to “freshen up” on your quantitative factor model knowledge (admit it, upon graduation from your MBA program you threw all that knowledge out the window!)
In words, the Fama French model claims that all market returns can roughly be explained by three factors: 1) exposure to the broad market (mkt-rf), 2) exposure to value stocks (HML), and 3) exposure to small stocks (SMB).
Here is a recap of exactly how the Fama French factors are created, a video on how the Fama French model works (see below), and a spreadsheet.
How to use the Fama and French 3-factor model
To answer the question of how to use the Fama and French model, I went ahead and built a simple spreadsheet model so blog readers can calculate some alphas and betas associated with the 3-factor model and get some ‘hands-on’ experience.
This article contains a link to a spreadsheet and more details on basic factor analysis.
I have posted data from French’s website into the excel document. Returns are from 1950–2010. The user can enter in data for their favorite index/mutual fund into column “I” and see how the returns stack up against the CAPM and the FF model.
For fun, I went ahead and plugged in the equal-weight CRSP universe (consists of all NYSE/AMEX/NASDAQ stocks–imagine Wilshire 5000). And here are the results:

The results are hypothetical results and are NOT an indicator of future results and do NOT represent returns that any investor actually attained. Indexes are unmanaged, do not reflect management or trading fees, and one cannot invest directly in an index. Additional information regarding the construction of these results is available upon request.
According to the CAPM, the EW CRSP index has an alpha of roughly 2.5%/year. However, when the FF model is used, the alpha drops to a mere 25bp a year, or essentially zero.
This brief analysis of the equal-weight CRSP index is a prime example of why the FF model is better than the CAPM–the FF model can actually tell you what is driving the returns (you’ll notice the .84 SMB estimate associated with the EW CRSP index).
And knowing what drives returns is important: We’ve all heard the tales of magical performance from the 1.5% and 20% “mini-Warren-Buffett-crowd” who run small value funds and continuously pound the table that they “beat the market.” Before FF, an allocator might look at these small-cap managers and think, “Wow, this manager has some secret sauce at their disposal and deserves a 1.5% management fee and 20% performance allocation.” Now, an allocator can use the FF model and quickly determine that the manager has little “alpha,” and can switch their allocation into a vanguard small-cap index fund that charges 25bp.
If you’re curious, go ahead and drag and drop returns of your favorite ‘active manager’ into the spreadsheet. In many cases, the CAPM will show that they have alpha, but when you examine their returns using the FF model you will quickly see that they don’t have “alpha,” merely an ability to invest in small caps and/or value stocks. Luckily, gaining exposure to small caps and/or value stocks is very cheap these days.
“Alpha” versus genuine “Value-add”
There is a great controversy over whether or not small stocks and value stocks are actually ‘riskier’ than other stocks in the universe. The arguments fall on two sides of the fence:
- Size and value represent “risk,” and therefore SHOULD earn higher average excess returns.
- Size and value represent “alpha,” and therefore provide investors with an opportunity to earn outsized risk-adjusted returns.
The evidence seems to suggest that value stocks, in particular, are actually a better deal than growth stocks. But regardless, getting back to the point mentioned earlier, be it risk or alpha, the empirical evidence is still the same: the FF model EXPLAINS returns.
Why does explaining returns matter?
In the grand scheme of things, the “alpha” vs “risk” argument is irrelevant for performance benchmarking because there are firms in the marketplace (e.g., our firm, DFA, Vanguard, iShares, etc.) that give investors access to small-caps and value stocks at low costs.
The key lesson is that one shouldn’t be asking whether or not their active manager can outperform the market, rather, they should be asking, given my active manager’s exposures to the market, size, and value, can he beat alternative products in the marketplace that charge ‘index’ fees and not ‘active’ fees.
Let us know if this was helpful.
About the Author: Wesley Gray, PhD
—
Important Disclosures
For informational and educational purposes only and should not be construed as specific investment, accounting, legal, or tax advice. Certain information is deemed to be reliable, but its accuracy and completeness cannot be guaranteed. Third party information may become outdated or otherwise superseded without notice. Neither the Securities and Exchange Commission (SEC) nor any other federal or state agency has approved, determined the accuracy, or confirmed the adequacy of this article.
The views and opinions expressed herein are those of the author and do not necessarily reflect the views of Alpha Architect, its affiliates or its employees. Our full disclosures are available here. Definitions of common statistics used in our analysis are available here (towards the bottom).
Join thousands of other readers and subscribe to our blog.

