Equity Volatility Term Structures and the Cross-Section of Option Return
- Aurelio Vasquez
- A version of the paper can be found here.
- Want a summary of academic papers with alpha? Check out our Academic Research Recap Category!
Abstract:
The slope of the implied volatility term structure is positively related with future option returns. We rank firms based on the slope of the volatility term structure and analyze the returns for five different option trading strategies. Option portfolios with high slopes of the volatility term structure outperform option portfolios with low slopes by an economically and statistically significant amount. The results are robust to different empirical setups and are not explained by well-known market, size, book-to-market, or momentum factors. Additional higher-order option-related factors, volatility risk premiums, jump risk, and existing option anomalies cannot explain the large option returns.
Data Sources:
1996-2007, OptionMetrics Ivy Database
Alpha Highlight:
Volatility term structure slope has a strong relation with different option strategy returns:
The results are hypothetical results and are NOT an indicator of future results and do NOT represent returns that any investor actually attained. Indexes are unmanaged, do not reflect management or trading fees, and one cannot invest directly in an index. Additional information regarding the construction of these results is available upon request.
Strategy Summary:
- Use data for all US equity options and their underlying prices from Jan 4, 1996 to June 30, 2007 (OptionMetrics Ivy database).
- On average there are 386 stocks per month.
- The slope of the volatility term structure is the difference between implied volatilities (IV) of long-dated and short-dated ATM options.
- The short-term volatility is the average of the one-month ATM put and call implied volatilities.
- The long-term volatility is the average of the longest-dated (and same strike as short term) ATM put and call implied volatilities.
- Each month, stocks are ranked based on the slope of the volatility term structure and then subsequent one month option returns are measured.
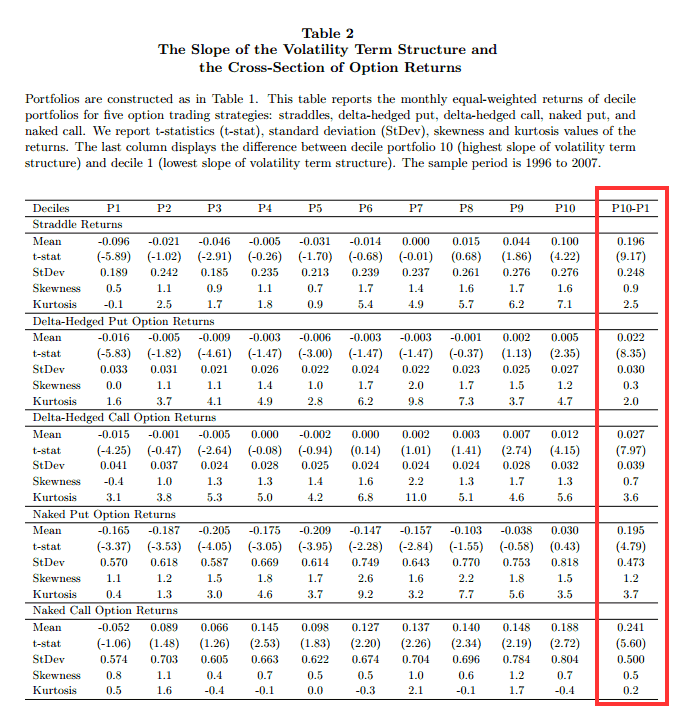
- Five option strategies include: Naked call, Naked put, Straddle, Delta-hedged call, and Delta-hedged put.
- Each option strategy above is tested, by going long the highest decile of IV, and short the lowest decile of IV.
- Buying straddles from the top decile for IV, and going short straddles from the bottom decile for IV earns an average monthly return of 19.6% before transaction costs (naked-call L/S earns 24.1%; see Table 2 for returns for other option strategies).
- After transaction costs (bid-ask spread), straddle L/S strategy yields significant 5.5% monthly return (naked call L/S earns insignificant 4.8% monthly return). This return becomes insignificant if bid-ask spread is higher than what is quoted (1.25 times quoted spread).
- It uses Fama-MacBeth regressions and double sorts to eliminate possible explanations.
- The outperformance of portfolios with high slope of the volatility term structure cannot be explained by size, book-to-market, momentum factors, volatility risk premium, jump risk, investor misreaction to volatility changes, option anomalies or firm characteristics.
Strategy Commentary:
- Bid-ask spread decreases the returns from 19.6% to 5.5% for the straddle L/S.
- There may be a way to increase returns by focusing on those options with lower bid-ask spreads.
- Interesting paper documenting how the term structure of IV impacts option returns.
Follow Vol Slope when you’re option trading!

About the Author: Wesley Gray, PhD
—
Important Disclosures
For informational and educational purposes only and should not be construed as specific investment, accounting, legal, or tax advice. Certain information is deemed to be reliable, but its accuracy and completeness cannot be guaranteed. Third party information may become outdated or otherwise superseded without notice. Neither the Securities and Exchange Commission (SEC) nor any other federal or state agency has approved, determined the accuracy, or confirmed the adequacy of this article.
The views and opinions expressed herein are those of the author and do not necessarily reflect the views of Alpha Architect, its affiliates or its employees. Our full disclosures are available here. Definitions of common statistics used in our analysis are available here (towards the bottom).
Join thousands of other readers and subscribe to our blog.