Mean Reversion, Momentum and Return Predictability
- Huang, Jiang, Tu, Zhou
- A version of the paper can be found here.
- Want a summary of academic papers with alpha? Check out our Academic Research Recap Category!
Abstract:
We document significant short-term time-series mean reversion in the up-market and momentum in the down-market. We find that the market risk premium for one to 12 months can be negatively predicted in the up-market and positively predicted in the down-market by a mean reversion indicator that is defined as the past year cumulative return of market portfolio minus its long term mean and standardized by its annualized volatility. This asymmetric predictability is significant in-sample and out-of-sample, and applies to cross-sectional portfolios sorted by size, book-to-market ratio, industry, momentum, and long- and short-term reversals. The finding of this paper is consistent with Veronesi (1999) that investors overreact to bad news in the up-market and underreact to good news in the down-market if they are uncertain about the market state.
Alpha Highlight:
You ever wanted to predict the market? It is tough, to say the least!
The authors in this paper propose an interesting idea that helps improve return predictability. The basic idea is that we need to control for the market state when estimating the relationship between a predictive variable and the future market return. For example, we know that momentum crashes occur following poor market environments and rarely occur following strong market environments. If we were to formalize this concept in a regression framework, we would enter 2 variables into our predictive regression:
I*mom(2,12) and (1-I)*mom(2,12). I is an indicator variable that is equal to 1 if the market is strong (e.g., positive over the past 12 months or if the market is above the 200-day moving average), and equal to zero, otherwise. In this framework, how we utilize the information about a stocks momentum from months 2 through 12 depends on the state of the market.
How do the authors use this concept more broadly?
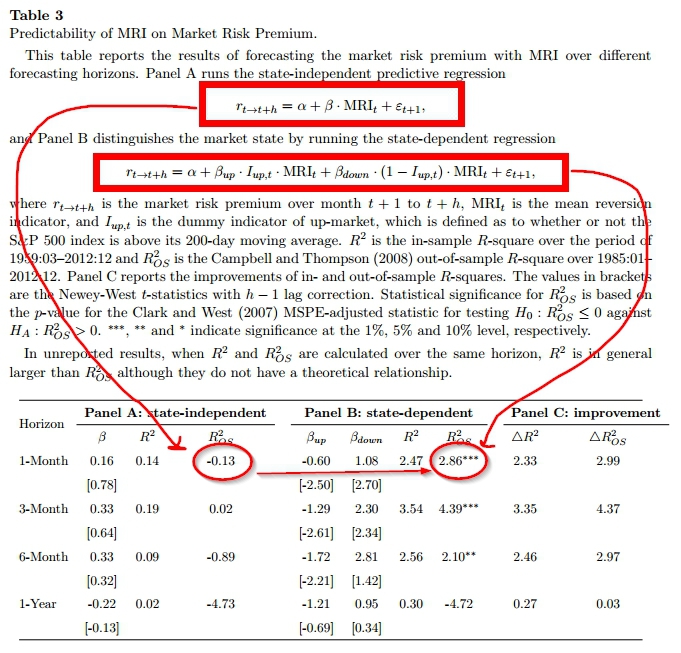
Essentially, the authors in this paper use the 200-day moving average as a “market regime indicator.” If the market is above the 200-day moving average, we are in a “good” regime, and if the market is below the 200-day moving average we are in a “bad” regime. The authors also introduce a new predictive variable, MRI, or mean reversion indicator.
MRI is equal to the past 12 months return on an asset minus its long term mean, divided by its annualized volatility. So if the market is ripping a 30% year, and the average annual return is 15%, we’d expect MRI to predict lower returns in the future. However, the authors hypothesize that this depends on market regime. If the market is trending, MRI is less important, if the market has stalled, its more likely to be predictive.
What are the results?
The results are hypothetical results and are NOT an indicator of future results and do NOT represent returns that any investor actually attained. Indexes are unmanaged, do not reflect management or trading fees, and one cannot invest directly in an index. Additional information regarding the construction of these results is available upon request.
The evidence suggests we can gain around a 3% edge in monthly market prediction using a state-dependent MRI model. 3% doesn’t sound like a lot, but in the market prediction game, that is a huge edge.
Without the state-dependent feature, MRI doesn’t help out of sample prediction at all
Any other ideas out there on predicting market returns?
About the Author: Wesley Gray, PhD
—
Important Disclosures
For informational and educational purposes only and should not be construed as specific investment, accounting, legal, or tax advice. Certain information is deemed to be reliable, but its accuracy and completeness cannot be guaranteed. Third party information may become outdated or otherwise superseded without notice. Neither the Securities and Exchange Commission (SEC) nor any other federal or state agency has approved, determined the accuracy, or confirmed the adequacy of this article.
The views and opinions expressed herein are those of the author and do not necessarily reflect the views of Alpha Architect, its affiliates or its employees. Our full disclosures are available here. Definitions of common statistics used in our analysis are available here (towards the bottom).
Join thousands of other readers and subscribe to our blog.