Our Asset Allocation Backtesting Tool is Live!
You can build and backest your own asset allocation portfolio using our “Allocation Architect” tool.
How to Access the Tool?
Step 1: Click “Our tools” tab from our main website page.

Click to enlarge.
Step 2: If you already have a username and password, please sign in. If you are new to our tool, just take 30 second to sign up and use it for free!
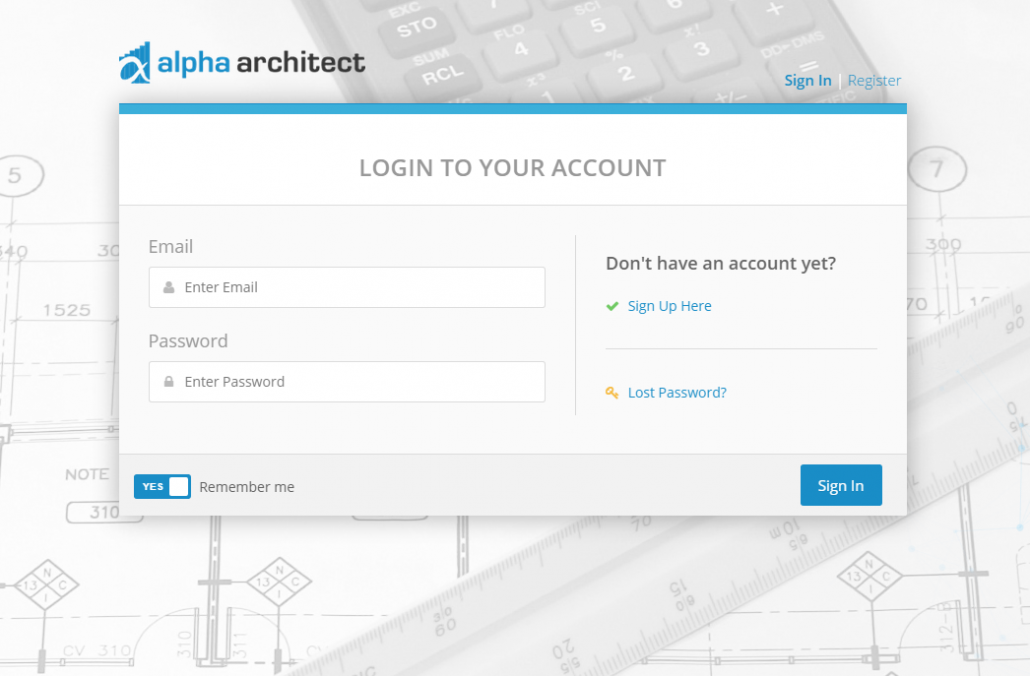
Click to enlarge.
Step 3: Click on the “Allocation Architect” Tool
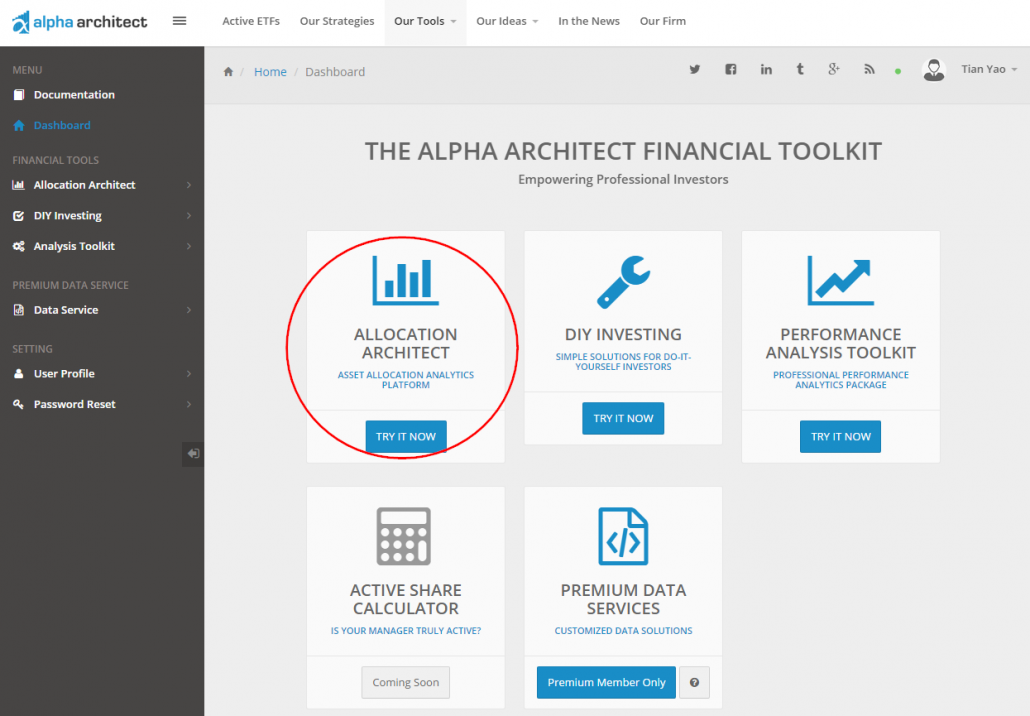
Click to enlarge.
How to Use the “Allocation Architect” Tool?
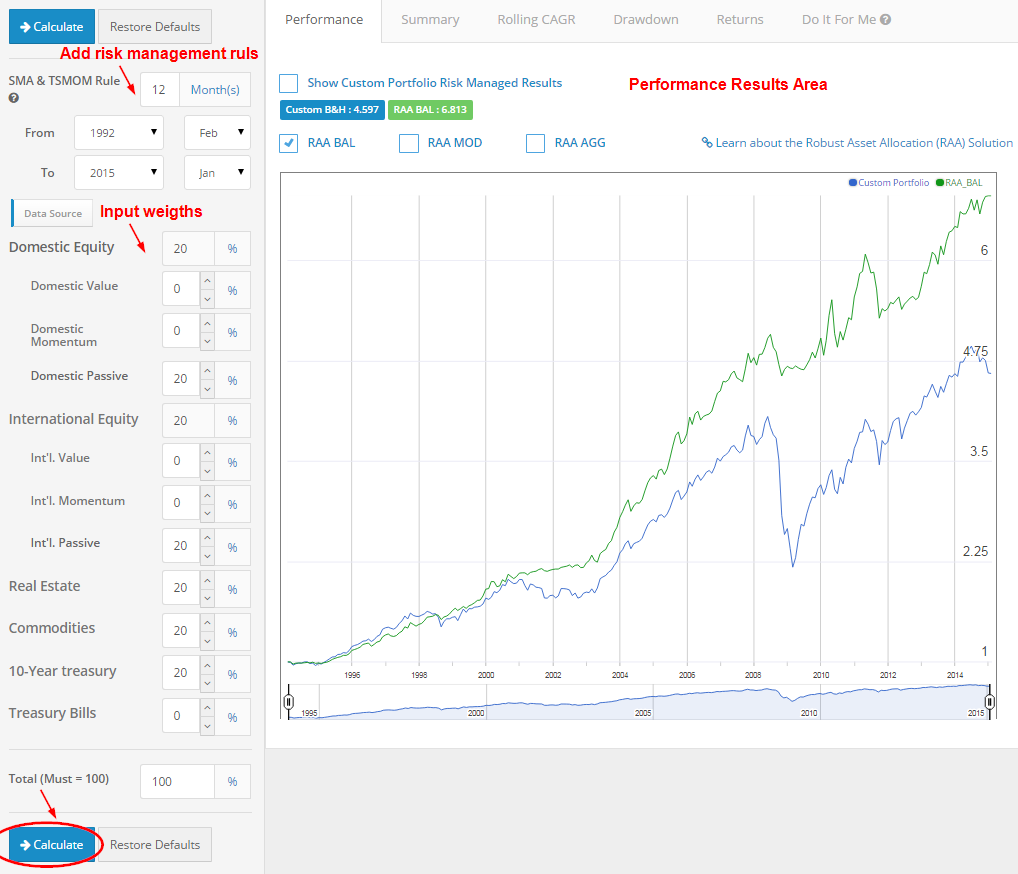
This tool will help you build a custom allocation portfolio by allowing the user to select different asset class weights, different time horizons, and toggle risk-management.
Step 1: Portfolio Inputs: select the time period you want to back test, and select the lookback for the risk-management rules (Simple Moving Average “SMA” rules and Time Series Momentum “TSMOM”). For example, if the user inputs “12” for the SMA and TSMOM rules, when risk-management is selected, the system will apply a 12-month SMA and a 12-month TSMOM rule to each asset class. If the asset class signal for SMA and TSMOM is positive, the asset will be 100% invested; if the signals are mixed, the asset will be 50% invested; and if the signals are both negative, the asset will be 0% invested (proceeds will go into treasury bills). SMA and TSMOM rules are explained here.
1. Time Series Momentum Rule (MOM)
- Excess return = total return over past x months less return of T-bill
- If Excess return >0, go long risky assets. Otherwise, go alternative assets (T-bills or Zero).
- Popularized by Gary Antonacci and rigorously examined by Moskowitz et al.
2. Simple Moving Average Rule (SMA)
- Moving Average (N) = average N month prices
- If Current Price – Moving Average (N) > 0, go long risky assets. Otherwise, go alternative assets (T-bills or Zero).
Step 2: Input custom allocation weights for the different assets: Input numbers directly or toggle the “up” and “down” buttons to adjust weights. We provide 5 core asset classes:
- Domestic Equity
- International Equity
- Real Estate
- Commodities
- 10-year Treasury Bonds
We also include value and momentum equity exposures for domestic and international markets as well as the treasury bill return.
The total weights must equal 100%.
*Tips: If you want to learn more about each asset, just point your mouse over them. You can get access to the data resources by clicking them.
Step 3: Click “Calculate” button to see the performance results.
Click to enlarge.
Understanding the Performance results
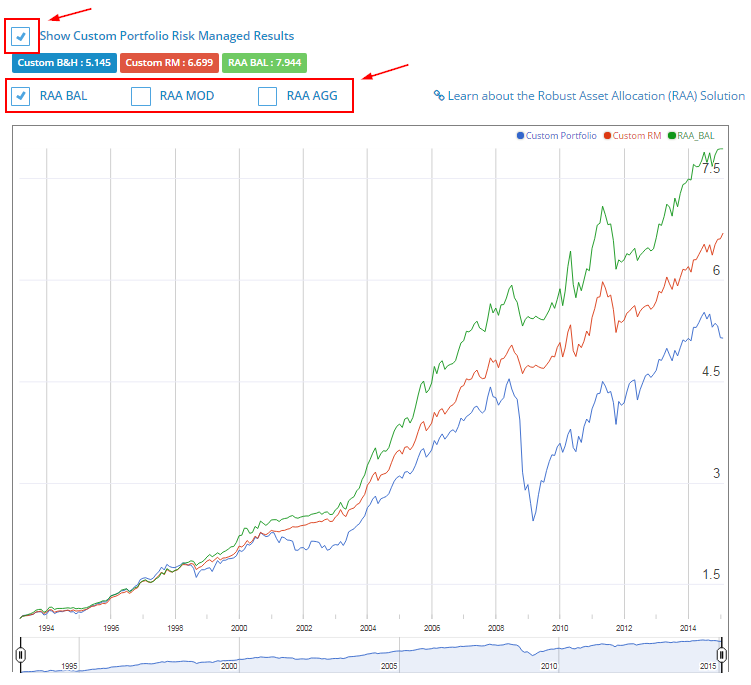
Step 1: When you hit the “Calculate” button the server will calculate your results (be patient, this could take 5 to 15 seconds).
- Show “risk managed” results by clicking the slider button.
- Your custom portfolio (with/without risk-managed) will be compared to the performance of the balanced version of the “Robust Asset Allocation Model.” The moderate and aggressive versions are also available by checking the boxes.
- RAA_BAL = 40% Equity; 40% Real; 20% Bonds. Equity split between value and momentum. Risk-Managed.
- RAA_MOD = 60% Equity; 20% Real; 20% Bonds. Equity split between value and momentum. Risk-Managed.
- RAA_AGG = 80% Equity; 10% Real; 10% Bonds. Equity split between value and momentum. Risk-Managed.
Click to enlarge.
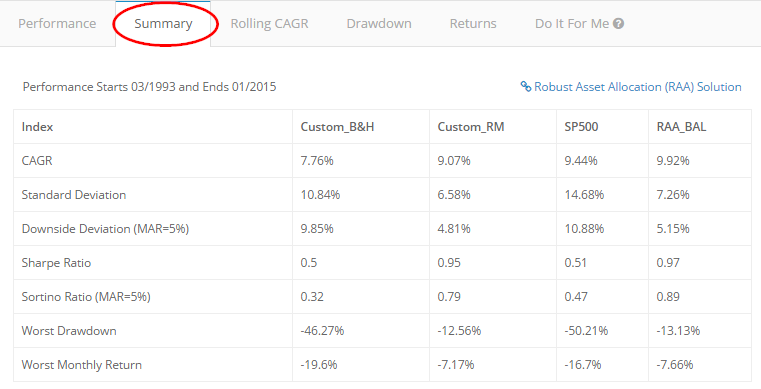
Step 2: The summary tab shows the summary statistics for each portfolio.
- CAGR: Compound annual growth rate
- Standard Deviation: Sample standard deviation
- Downside Deviation: Sample standard deviation, but only monthly observations below 41.67bps (5%/12) are included in the calculation
- Sharpe Ratio (annualized): Average monthly return minus treasury bills divided by standard deviation
- Sortino Ratio (annualized): Average monthly return minus treasury bills divided by downside deviation
- Worst Drawdown: Worst peak to trough performance (measured based on monthly returns)
Click to Enlarge.
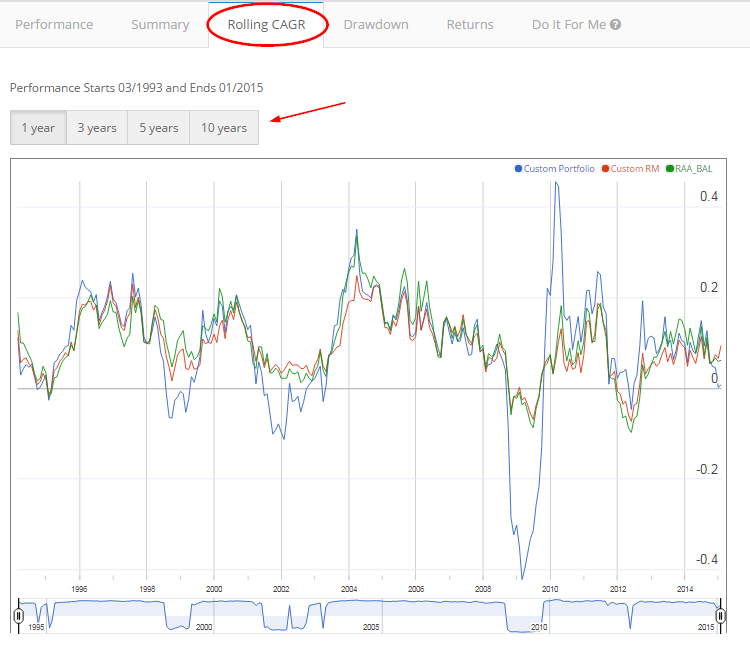
Step 3: The Rolling CAGR shows the rolling compound annual growth rates over X years. We provide results for 1-, 3-, 5-, and 10-year rolling horizons when the data is available.
Click to Enlarge.
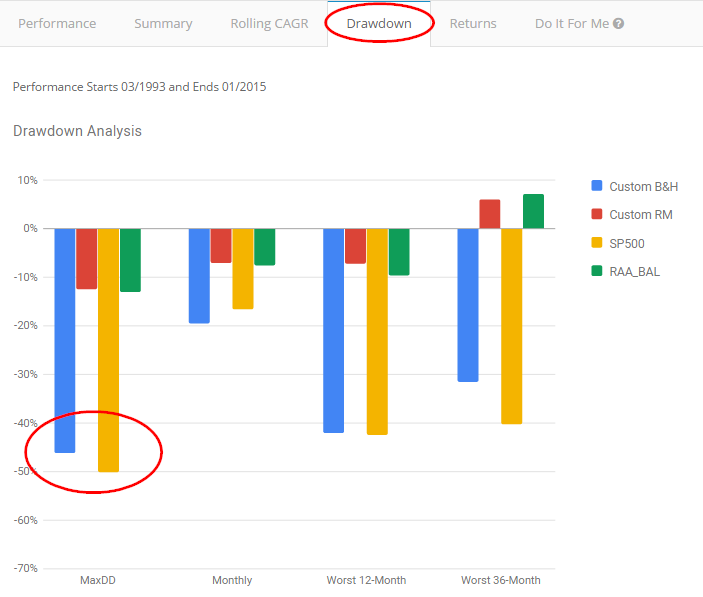
Step 4: The Drawdown tab shows the summary statistics for each portfolio.
- The Max Drawdown measure is calculated as the peak-to-trough decline since inception, using monthly returns.
- The Worst-Case Holding Period returns calculate all possible holding period returns for a given holding period length and reports the worst possible holding period return. For example, the worst 6-month holding period return is identified by calculating all possible 6-month holding period returns since inception. For a 12-month track record, there would be 7 possible 6-month holding period returns (e.g., month 1 to month 6, month 2 to month 7, and so forth). We then report the 6-month holding period return that has the worst performance as the worst 6-month holding period return. It is possible that the worst possible 3-month holding period return may be worse than the worst possible 6-month holding period return, because the holding period requirement is different. For example, there might be a -10% 3-month holding period return from month 1 to month 3, and a month 1 to month 6 holding period return of -5%, which happens to be the worst 6-month holding period return. In this scenario the worst case 3-month holding period return will be larger than the worst case 6-month holding period return.
Click to enlarge.
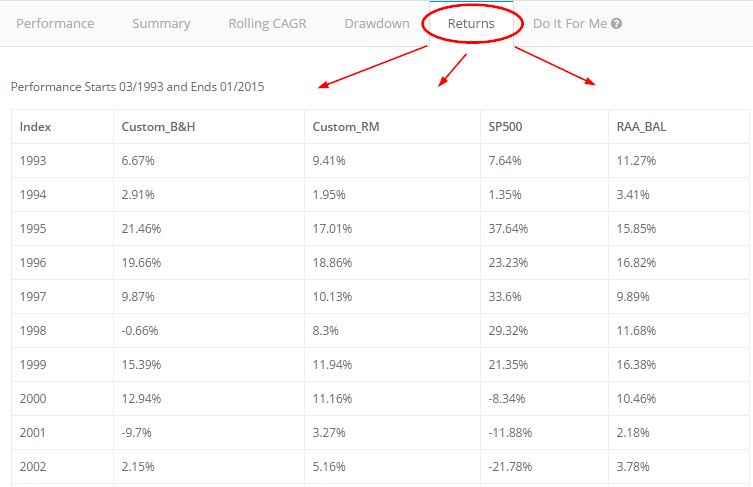
Step 5: The returns tab shows the annual returns for each portfolio.
Click to enlarge.
Access the Allocation Architect Tools here.

About the Author: Wesley Gray, PhD
—
Important Disclosures
For informational and educational purposes only and should not be construed as specific investment, accounting, legal, or tax advice. Certain information is deemed to be reliable, but its accuracy and completeness cannot be guaranteed. Third party information may become outdated or otherwise superseded without notice. Neither the Securities and Exchange Commission (SEC) nor any other federal or state agency has approved, determined the accuracy, or confirmed the adequacy of this article.
The views and opinions expressed herein are those of the author and do not necessarily reflect the views of Alpha Architect, its affiliates or its employees. Our full disclosures are available here. Definitions of common statistics used in our analysis are available here (towards the bottom).
Join thousands of other readers and subscribe to our blog.