Quick Summary
- For a bond momentum strategy, it makes sense to select the top 3 or top 6 funds.
- The starting universe matters.
- One must consider the taxes and transaction costs associated with the strategy, which can be significant.
Background
Proponents of the momentum investing philosophy suggest that riding past winners and cutting past losers generate robust premiums. As previously documented (substantiated by academic finance research) this does not just apply to individual stocks alone, as Momentum is everywhere. Momentum investing can be applied to other asset classes, such as bonds, currencies, and commodities.
Recently, CXO Advisory posted two articles (here and here) that apply a simple momentum investing strategy on Bond mutual funds. The results are attractive.
How it works: CXO Advisory’s Simple Bond Momentum Strategy
CXO Advisory’s simple Bond Momentum Strategy selects the top fund (ranked on past three-month momentum) with a monthly rebalance frequency.
This simple momentum strategy has higher CAGR, but also has higher volatility and lower Sharpe ratios:
The average monthly return for the 3-1 strategy beats those of all individual components, but with relatively high volatility. Gross monthly reward-to-risk ratios (rough gross Sharpe ratios) for the 3-1 strategy and the EW benchmark are 0.34 and 0.43, respectively (i.e. bond momentum has lower Sharpe Ratio).
A Solution to increase Risk-Adjusted Returns (Sharpe ratio)
In general, diversification can lower volatility. A simple idea is to allocate to either the top 3 or top 6 bond funds ranked on momentum.
First let’s set up the field of bond funds used in the CXO strategy. Below is the list of 12 bond mutual funds from this post:
- T. Rowe Price New Income (PRCIX)
- Thrivent Income A (LUBIX)
- Vanguard GNMA Securities (VFIIX)
- T. Rowe Price High-Yield Bonds (PRHYX)
- T. Rowe Price Tax-Free High Yield Bonds (PRFHX)
- Vanguard Long-Term Treasury Bonds (VUSTX)
- T. Rowe Price International Bonds (RPIBX)
- Fidelity Convertible Securities (FCVSX)
- PIMCO Short-Term A (PSHAX)
- Fidelity New Markets Income (FNMIX)
- Eaton Vance Government Obligations C (ECGOX)
- Vanguard Long-Term Bond Index (VBLTX)
The data begins in 3/1997 (as limited by PSHAX). Our returns start on 6/1/1997 and run until 1/31/2015 (need 3 months of data for our initial “ranking”). The results are gross of fees. All returns are total returns and include the reinvestment of distributions (e.g., dividends). Data is from Bloomberg.
Four monthly rebalanced portfolios are formed as follows:
- MOM (3M) Top 1 CXO = Every month, allocate to the fund with the highest 3-month momentum.
- MOM (3M) Top 3 CXO = Every month, allocate to the top 3 funds with the highest 3-month momentum.
- MOM (3M) Top 6 CXO = Every month, allocate to the top 6 funds with the highest 3-month momentum.
- Bond EW CXO = Equal-weight across the 12 funds.
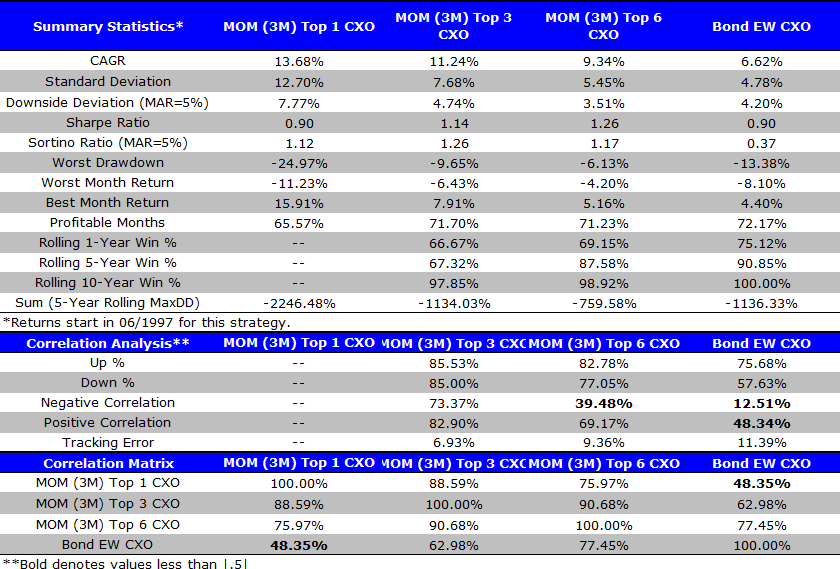
Summary Statistics (6/1/1997 – 1/31/2015):
The results are hypothetical results and are NOT an indicator of future results and do NOT represent returns that any investor actually attained. Indexes are unmanaged, do not reflect management or trading fees, and one cannot invest directly in an index. Additional information regarding the construction of these results is available upon request.
Takeaways:
- The simple bond momentum strategy that invests in the top fund over the past 3 months has the highest CAGR, but comes with higher volatility and the same Sharpe ratio as the equal-weight strategy. Our implementation of CXO’s strategy yields similar results (their data runs starts in 1994 — so the results are not identical).
- Examining the results when allocating to the top 3 and top 6 funds, we find lower CAGR, but higher risk-adjusted performance (Sharpe and Sortino ratios) compared to the top one fund strategy. The top 3 and top 6 fund strategy outperforms the equal-weight strategy on both a CAGR and risk-adjusted basis. Of course, this does not include transaction costs and taxes.
Are CXO’s results driven by particular funds?
Two of the funds which are very often in the top 1, 3 and 6 are FCVSX (Convertible Securities) and FNMIX (Emerging Markets Income). Since Convertibles are similar to stocks, and Emerging Markets may be considered a smaller allocation in most portfolios, we want to see what happens when we take these two funds out. We then run the same analysis on the other 10 funds.
Four monthly rebalanced portfolios are formed as follows:
- MOM (3M) Top 1 CXO (exclude 2) = Every month, allocate to the fund with the highest 3-month momentum (excluding FCVSX and FNMIX from the sample).
- MOM (3M) Top 3 CXO (exclude 2) = Every month, allocate to the top 3 funds with the highest 3-month momentum (excluding FCVSX and FNMIX from the sample).
- MOM (3M) Top 6 CXO (exclude 2) = Every month, allocate to the top 6 funds with the highest 3-month momentum (excluding FCVSX and FNMIX from the sample).
- Bond EW CXO (exclude 2) = Equal-weight across the 10 funds (excluding FCVSX and FNMIX from the sample).
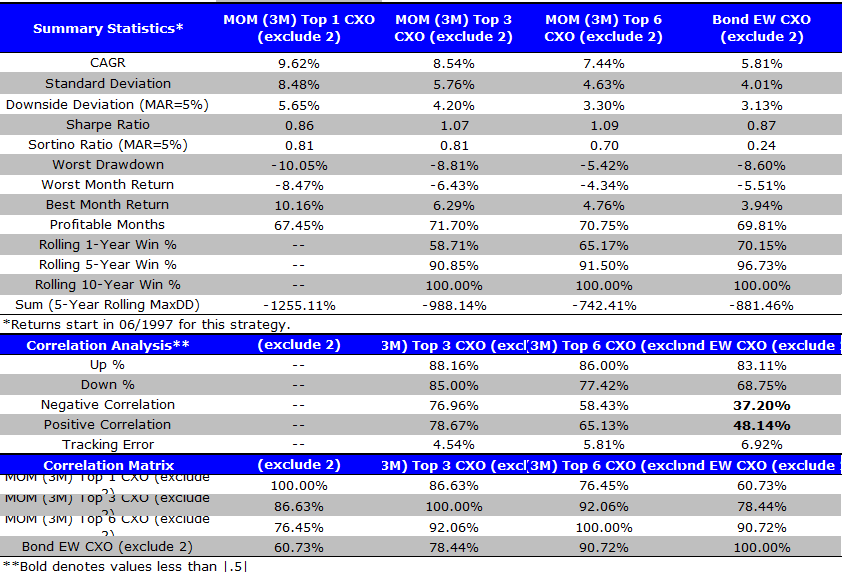
Summary Statistics (6/1/1997 – 1/31/2015):
The results are hypothetical results and are NOT an indicator of future results and do NOT represent returns that any investor actually attained. Indexes are unmanaged, do not reflect management or trading fees, and one cannot invest directly in an index. Additional information regarding the construction of these results is available upon request.
Takeaways:
- Excluding Convertibles and Emerging Market debt yields similar results: The simple bond momentum strategy that invests in the top fund over the past 3 months has the highest CAGR, but comes with higher volatility and the same Sharpe ratio as the equal-weight strategy.
- Examining the results when allocating to the top 3 and top 6 funds, we find lower CAGR, but higher risk-adjusted performance (Sharpe and Sortino ratios) compared to the top one fund strategy. The top 3 and top 6 fund strategy outperforms the equal-weight strategy on both a CAGR and risk-adjusted basis.
Testing the momentum strategy with different bond funds
Before the CXO post, we were working on a similar project, but selected a different sample of bond funds. Specifically, we selected 12 Bond ETFs to make up our universe. We did not include GNMA bonds, Convertibles, International, or Emerging market bonds as in the CXO post.
Here are the 4 different types of bonds we examined: Government bond ETFs, Corporate bond ETFs, Municipal bond ETFs and Total bond market ETFs. For each of the 4 categories, we have 3 bonds with different durations: long-term, intermediate-term and short-term.
Below is the list of 12 ETFs (duration and average maturity included):
Government Bond ETFs (3)
- 20+ Year Treasury Bond ETF (TLT) — 17.76 years/26.93 years
- iShares 7-10 Year Treasury Bond ETF (IEF) — 7.74 years/8.59 years
- 1-3 Year Treasury Bond ETF (SHY) — 1.85 years/1.88 years
Corporate Bond ETFs (3)
- SPDR Barclays Capital Long Term Corporate Bond ETF (LWC) — 13.92 years/23.85 years
- iShares Intermediate Credit Bond ETF (CIU) — 4.23 years/4.74 years
- iShares 1-3 Year Credit Bond ETF (CSJ) — 1.90 years/2.00 years
Municipal Bond ETFs (3)
- Market Vectors-Long Municipal Index ETF (MLN) — 11.34 years/24.32 years
- Market Vectors-Intermediate Municipal Index ETF (ITM) — 7.16 years/10.72 years
- SPDR Barclays Short Term Municipal Bond ETF (SHM) — 2.85 years/3.09 years
Total Bond Market ETFs (3)
- Long-Term Bond ETF (BLV) — 15.0 years/24.2 years
- iShares Intermediate Government/Credit Bond ETF (GVI) — 3.83 years/4.17 years
- Short-Term Bond ETF (BSV) — 2.70 years/2.70 years
The data runs from 4/1/2009 (as limited by LWC) to 1/31/2015. Strategy returns start on 7/1/2009 as we have 3 month look-back periods. Results are gross of fees. All returns are total returns and include the reinvestment of distributions (e.g., dividends).
For each of the 12 Bonds ETFs, we calculate the 3-month (3M) momentum every month. Monthly rebalanced portfolios are formed as follows:
- MOM (3M) Top 1 ETF = Every month, allocate to the ETF with the highest 3-month momentum.
- MOM (3M) Top 3 ETF = Every month, allocate to the top 3 ETFs with the highest 3-month momentum.
- MOM (3M) Top 6 ETF = Every month, allocate to the top 6 ETFs with the highest 3-month momentum.
- Bond EW ETF= Equal-weight to the 12 Bond ETFs.
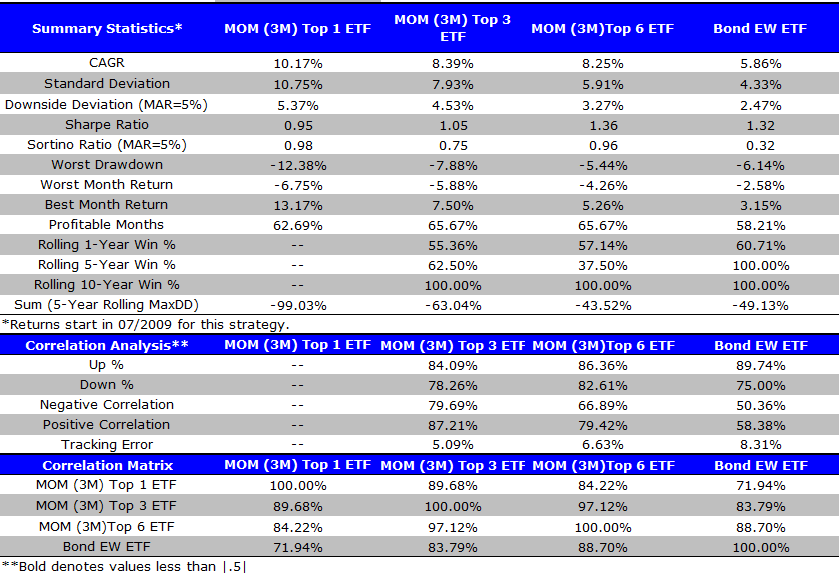
Statistics Summary (7/1/2009 – 1/31/2015):
The results are hypothetical results and are NOT an indicator of future results and do NOT represent returns that any investor actually attained. Indexes are unmanaged, do not reflect management or trading fees, and one cannot invest directly in an index. Additional information regarding the construction of these results is available upon request.
Takeaways:
- Compared to the equal-weight strategy (Bond EW ETF), all three momentum strategies have a higher CAGR. However, the momentum strategies have higher standard deviations and drawdowns.
- The MOM (3M) Top 1 ETF strategy, has the highest CAGR but also is more volatile than the others. The MOM (3M) Top 6 ETF strategy has highest Sharpe and Sortino ratio.
- From a drawdown analysis, MOM (3M) Top 1 ETF Strategy has the highest drawdown. MOM (3M) Top 3 and 6 ETF strategies also have higher drawdowns compared with equal weight strategy.
Testing the momentum strategy with mutual funds for longer time periods:
The tests above show promising results of using cross-sectional momentum on Bond ETFs. However, the ETF data period is very short (returns start in 7/2009) and does not include different market cycles. To get the results over a longer time period, we apply the same rules using mutual funds (3-month look-back, holding the top 1, 3, and 6 funds each month).
For the mutual funds sample, we select 12 Vanguard bond mutual funds (MF). Similar to the ETF strategy, we use 4 categories of bond types with 3 different durations. The data runs from 3/1/1994 (as limited by VBLTX) to 1/31/2015. The returns start from 6/1/1994 since we have 3-month look-back periods. Please note that the inception dates of VBILX and VBIRX are at the end of 2001, so we use ABNDX and LALDX before their inceptions.
For each of the 12 Bonds Mutual Funds, we calculate the 3-month (3M) momentum every month. Monthly rebalanced portfolios are formed as follows:
- MOM (3M) Top 1 MF = Every month, allocate to the Mutual Fund (MF) with the highest 3-month momentum.
- MOM (3M) Top 3 MF = Every month, allocate to the top 3 MFs with the highest 3-month momentum.
- MOM (3M) Top 6 MF = Every month, allocate to the top 6 MFs with the highest 3-month momentum.
- Bond EW MF = Equal-weight to the 12 Bond MFs.
Below is the list of 12 ETFs (duration and average included):
Government bond type (3)
- Vanguard Long-Term Treasury Inv (VUSTX) –16.8 years/25.0 years
- Vanguard GNMA Inv (VFIIX) — 3.5 years/5.5 years
- Vanguard Short-Term Treasury Fund Investor Shares (VFISX) — 2.3 years/2.4 years
Corporate bond type (3)
- Vanguard Long-Term Investment-Grade Fund Investor Shares (VWESX) — 13.5 years/23.0 years
- Vanguard Intermediate-Term Investment-Grade Fund Investor Shares (VFICX) — 5.4 years/6.1 years
- Vanguard Short-Term Investment-Grade Fund Admiral Shares (VFSTX) — 2.5 years/3.0 years
Municipal bond type (3)
- Vanguard Long-Term Tax-Exempt Fund Investor Shares (VWLTX) — 6.0 years/15.9 years
- Vanguard Intermediate-Term Tax-Exempt Fund Investor Shares (VWITX) — 4.8 years/ 8.7 years
- Vanguard Short-Term Tax-Exempt Fund Investor Shares (VWSTX) — 1.0 years/1.5 years
Total Bond Market (3)
- Vanguard Long-Term Bond Index Inv (VBLTX) — 15.0 years/24.2 years
- Vanguard Intermediate-Term Bond Index Fund Admiral Shares (VBILX) — 6.5 years/7.2 years
- Vanguard Short-Term Bond Index Fund Admiral Shares (VBIRX) — 2.7 years/2.7 years
Strategy returns start on 6/1/1994 as we have 3 month look-back periods. Results are gross of fees. All returns are total returns and include the reinvestment of distributions (e.g., dividends).
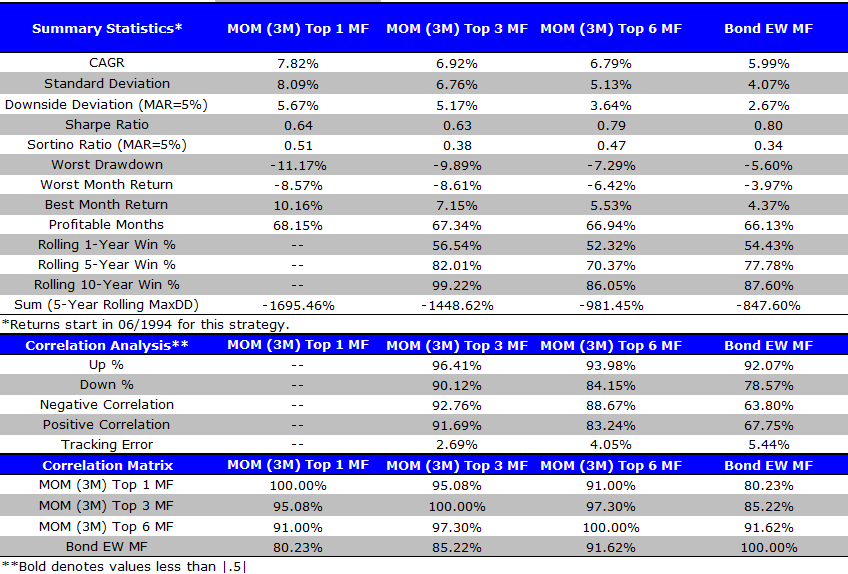
Full Sample (6/1/1994-1/31/2015):
The results are hypothetical results and are NOT an indicator of future results and do NOT represent returns that any investor actually attained. Indexes are unmanaged, do not reflect management or trading fees, and one cannot invest directly in an index. Additional information regarding the construction of these results is available upon request.
Takeaway:
- Using data which goes back to 1994, the bond momentum strategies again have higher CAGRs, but with higher volatility and lower Sharpe ratios relative to the simple equal-weight strategy.
Invested Growth Figure (6/1/1994-1/31/2015):
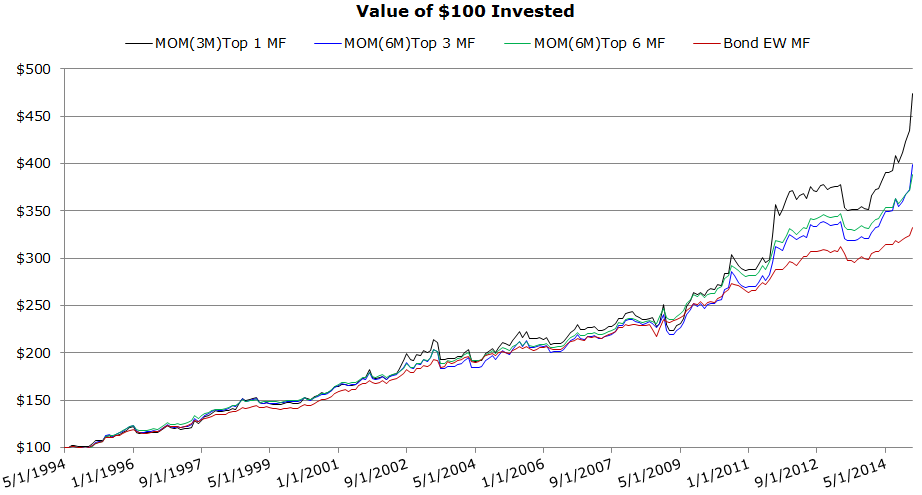
The results are hypothetical results and are NOT an indicator of future results and do NOT represent returns that any investor actually attained. Indexes are unmanaged, do not reflect management or trading fees, and one cannot invest directly in an index. Additional information regarding the construction of these results is available upon request.
Takeaways:
- Bond momentum strategies appear to work well starting in 2009 (see growth chart above).
- Need to understand performance pre and post 2009.
First part of sample (6/1/1994-12/31/2008):
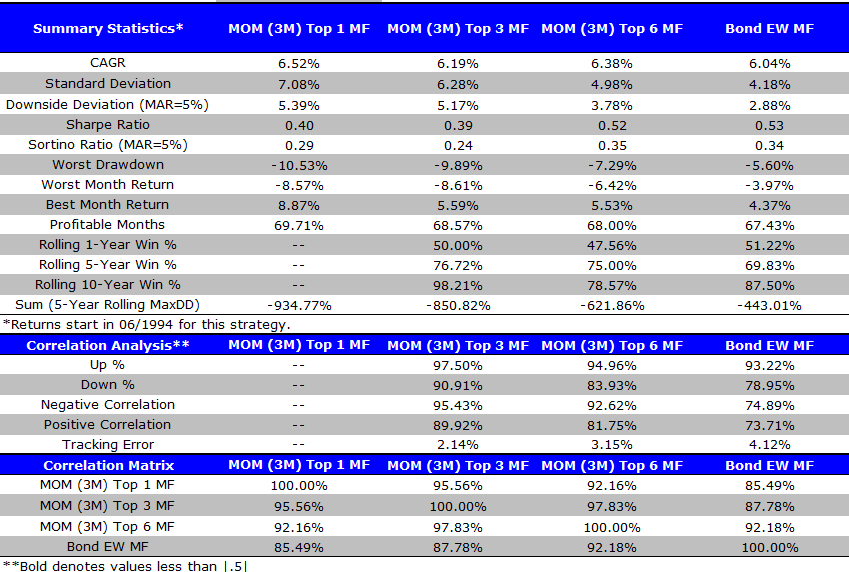
The results are hypothetical results and are NOT an indicator of future results and do NOT represent returns that any investor actually attained. Indexes are unmanaged, do not reflect management or trading fees, and one cannot invest directly in an index. Additional information regarding the construction of these results is available upon request.
Takeaway:
- Very little out-performance (if any) for the bond momentum strategies from 1994-2008.
Second part of Sample: 1/1/2009-1/31/2015
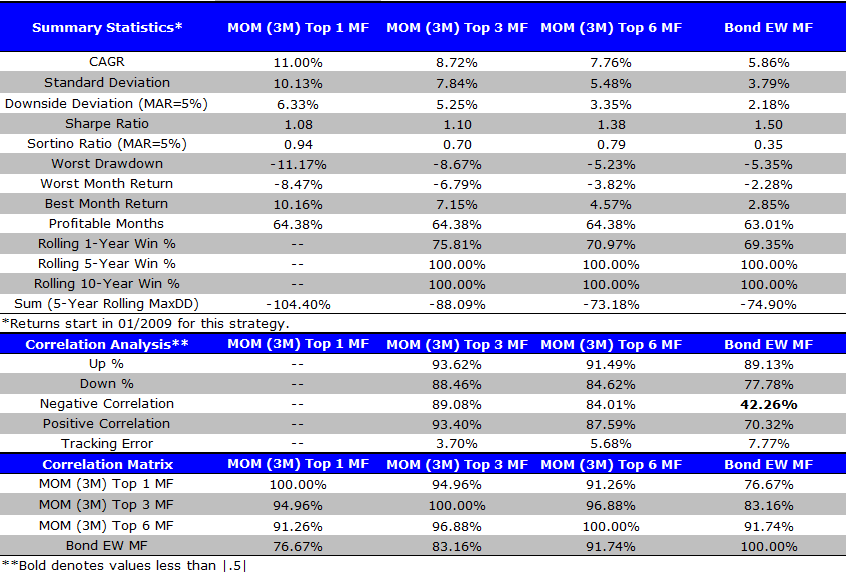
The results are hypothetical results and are NOT an indicator of future results and do NOT represent returns that any investor actually attained. Indexes are unmanaged, do not reflect management or trading fees, and one cannot invest directly in an index. Additional information regarding the construction of these results is available upon request.
Takeaways:
- Since 2009, on a CAGR basis, the bond momentum strategies have worked better than the equal-weight strategy.
- However, on a Sharpe ratio comparison, the simple equal-weight approach may have been better.
Summary:
What should we make of all these results?
- If implementing a bond momentum investing strategy, it makes sense to select the top 3 or top 6 funds — this increased diversification reduces volatility, and increases risk-adjusted returns (Sharpe ratio) across all the samples.
- The universe you begin with matters. As shown above, when including convertible and emerging market bonds, the CAGR is higher — which makes sense as these are “riskier” securities, so we should expect to see a risk premium for holding these.
- If you are a taxable investor, switching from one fund to another is costly! I did not even mention taxes or transaction costs. After accounting for these, the simple equal-weight, buy-and-hold approach in bonds may be the better bet.

About the Author: Jack Vogel, PhD
—
Important Disclosures
For informational and educational purposes only and should not be construed as specific investment, accounting, legal, or tax advice. Certain information is deemed to be reliable, but its accuracy and completeness cannot be guaranteed. Third party information may become outdated or otherwise superseded without notice. Neither the Securities and Exchange Commission (SEC) nor any other federal or state agency has approved, determined the accuracy, or confirmed the adequacy of this article.
The views and opinions expressed herein are those of the author and do not necessarily reflect the views of Alpha Architect, its affiliates or its employees. Our full disclosures are available here. Definitions of common statistics used in our analysis are available here (towards the bottom).
Join thousands of other readers and subscribe to our blog.