A recent academic paper, Equal or Value Weighting? Implications for Asset-Pricing Tests, highlights two methods of weighting: Equal-weight and Value weight.
As the paper states:
With monthly rebalancing, an equal-weighted portfolio outperforms a value-weighted portfolio in terms of total mean return, four-factor alpha, and Sharpe ratio…The higher systematic return of the equal-weighted portfolio relative to the value- and price-weighted portfolios arises from its relatively higher exposure to the value, size, and market factors.
This paper summarizes the key findings from an old post we did almost a year and half ago:
The Value-weight VS. Equal-weight Update
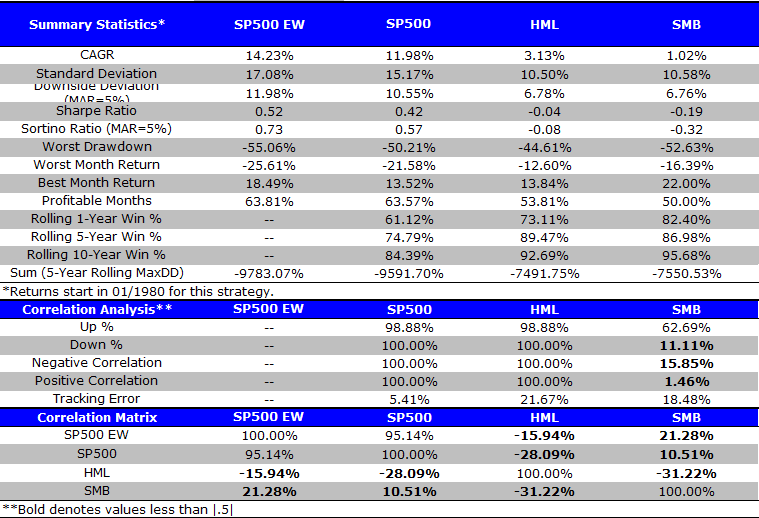
We updated the EW vs. VW horse race with latest data: From 1/1/1963 to 2/28/2015, SP500 Equal-weight outperforms SP500 Value-weight by 2.25%, annually. The strategy delivers higher Sharpe and Sortino ratios.
The results are hypothetical results and are NOT an indicator of future results and do NOT represent returns that any investor actually attained. Indexes are unmanaged, do not reflect management or trading fees, and one cannot invest directly in an index. Additional information regarding the construction of these results is available upon request.
Many people attribute the EW premium to the “size” factor. What does that mean? As we know, the SP500 EW includes the exact same companies as the SP500 VW, however, the EW version gives equal-weight to each company, regardless of size. In other words, Apple Inc (Market Cap: ~755B) has the same weight as Diamond Offshore Drilling Inc (Market Cap: ~ 4.46B) in the EW index.
So size is definitely one reason why the EW index has likely outperformed the VW index, but size isn’t everything…
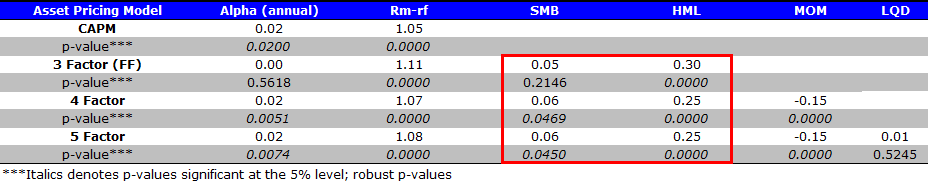
Factor analysis on SP 500 EW
Below we highlight the factor analysis for the S&P500 EW. A few observations:
- A small size tilt (as measured by SMB).
- A fairly large exposure to the “value factor” (HML), which suggests that the EW Index performance is driven not only by size, but also by value!
- The EW index also a beta of ~1.1, giving it a little more market risk than the VW index.
The results are hypothetical results and are NOT an indicator of future results and do NOT represent returns that any investor actually attained. Indexes are unmanaged, do not reflect management or trading fees, and one cannot invest directly in an index. Additional information regarding the construction of these results is available upon request.
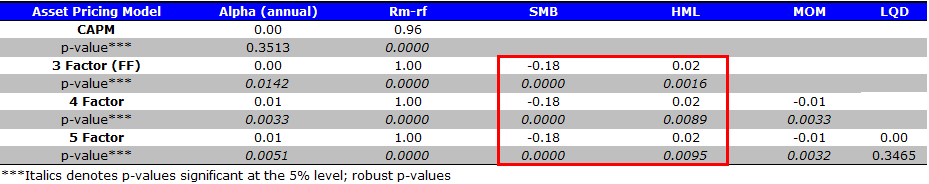
Below we show the factor analysis of S&P500 VW. A few comments:
- A beta of 1, which is intuitive.
- A negative size factor (i.e., the value-weight index tilts large).
- A flat value exposure.
SP500EW factor analysis The results are hypothetical results and are NOT an indicator of future results and do NOT represent returns that any investor actually attained. Indexes are unmanaged, do not reflect management or trading fees, and one cannot invest directly in an index. Additional information regarding the construction of these results is available upon request.
Summary Findings
Casual market observers suggest that the EW index is driven by a small cap bias. This observation may a bit too casual.
The evidence suggests that much of the outperformance is likely driven by a heavy value exposure and a slightly higher beta.
Going forward, and assuming that the factor loadings stay the same, we can expect the S&P 500 EW index to outperform if small-caps earn a premium, value-stocks earn a premium, and the market continues to grind higher over the long-haul.
Good luck,
Wes
About the Author: Wesley Gray, PhD
—
Important Disclosures
For informational and educational purposes only and should not be construed as specific investment, accounting, legal, or tax advice. Certain information is deemed to be reliable, but its accuracy and completeness cannot be guaranteed. Third party information may become outdated or otherwise superseded without notice. Neither the Securities and Exchange Commission (SEC) nor any other federal or state agency has approved, determined the accuracy, or confirmed the adequacy of this article.
The views and opinions expressed herein are those of the author and do not necessarily reflect the views of Alpha Architect, its affiliates or its employees. Our full disclosures are available here. Definitions of common statistics used in our analysis are available here (towards the bottom).
Join thousands of other readers and subscribe to our blog.