Frog in the Pan: Continuous Information and Momentum
- Da, Gurun and Warachka
- A version of the paper can be found here.
- Want a summary of academic papers with alpha? Check out our Academic Research Recap Category.
Abstract:
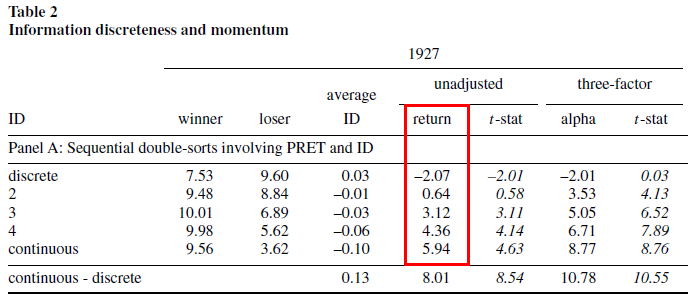
We test a frog-in-the-pan (FIP) hypothesis that predicts investors are inattentive to information arriving continuously in small amounts. Intuitively, we hypothesize that a series of frequent gradual changes attracts less attention than infrequent dramatic changes. Consistent with the FIP hypothesis, we find that continuous information induces strong persistent return continuation that does not reverse in the long run. Momentum decreases monotonically from 5.94% for stocks with continuous information during their formation period to –2.07% for stocks with discrete information but similar cumulative formation period returns. Higher media coverage coincides with discrete information and mitigates the stronger momentum following continuous information.
Alpha Highlight:
The account of the boiling frog is an anecdote describing a frog in a pan of water. If the frog is put into boiling water, it will immediately jump out. If it’s placed, however, in cold water that is slowly warming up, it won’t be aware of the gradual heat change, and it will be cooked to death.
Investors act in a similar manner with respect to gradual stock price changes. For example, for a stock with an immediate 100% gain (boiling water) the new fair value is immediately recognized by all investors, whereas, gradual stock price changes (cold water slowly warmed up to boiling temperature) often receive less attention. In behavioral finance academic parlance, investors suffer from limited attention when it comes to gradual stock price changes.
In this paper, Da, Gurun and Warachka (2012) investigate investors’ limited attention to gradual-information diffusion and hypothesize that it has a conditional relationship with momentum.
- Frog-in-the-pan (FIP) hypothesis: “a series of frequent gradual changes attracts less attention than infrequent dramatic changes. Investors therefore underreact to continuous information.”
The conclusions are clear: a more sophisticated momentum strategy that focuses on the path-dependency of momentum generates a much stronger momentum effect.
Key Findings:
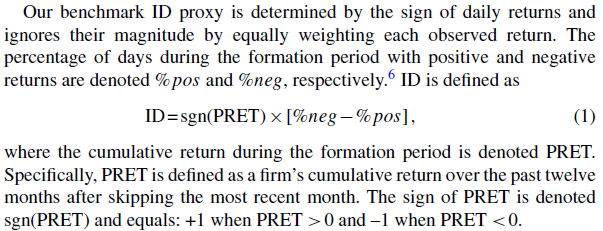
This paper constructs a proxy for information discreteness (ID) that measures the relative frequency of small signals. A large ID means more discrete information, and a small ID denotes continuous information. For past winners with a high past return, a high percentage of positive returns (% pos> % neg) implies there are a large number of small positive returns.
Next, the authors double-sorted portfolios that condition first on a 12-month formation-period returns (Jegadeesh and Titman 1993), then second on ID during the 1927 to 2007 sample period. They find that over a six-month holding period, momentum decreases monotonically from 5.94% for stocks with continuous information to –2.07% for stocks with discrete information.
The results are hypothetical results and are NOT an indicator of future results and do NOT represent returns that any investor actually attained. Indexes are unmanaged, do not reflect management or trading fees, and one cannot invest directly in an index. Additional information regarding the construction of these results is available upon request.
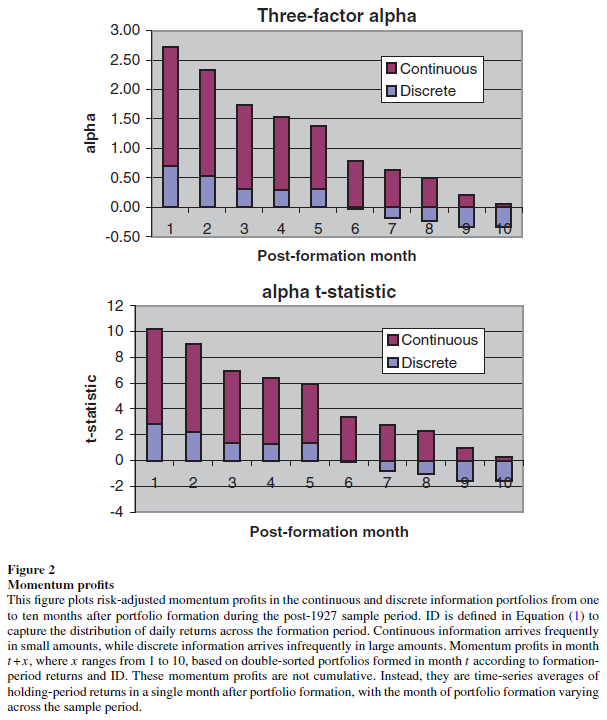
Wow. The graph below shows the momentum alphas following continuous and discrete information from 1 to 10 months after portfolio formation. The results are consistent with the FIP hypothesis–continuous, or “quality,” momentum seems to account for much of the momentum effect. Specifically:
- Higher profits: High-quality, or continuous, momentum stocks have higher three-factor alphas than low-quality, or discrete, momentum stocks.
- Longer persistence: Momentum profits following continuous information persist longer (the t-stat remains significant for about 8 months); while Momentum profits following discrete information persist only 2 months (i.e., an investor can trade momentum less frequent and still win).
The results are hypothetical results and are NOT an indicator of future results and do NOT represent returns that any investor actually attained. Indexes are unmanaged, do not reflect management or trading fees, and one cannot invest directly in an index. Additional information regarding the construction of these results is available upon request.
Takeaways:
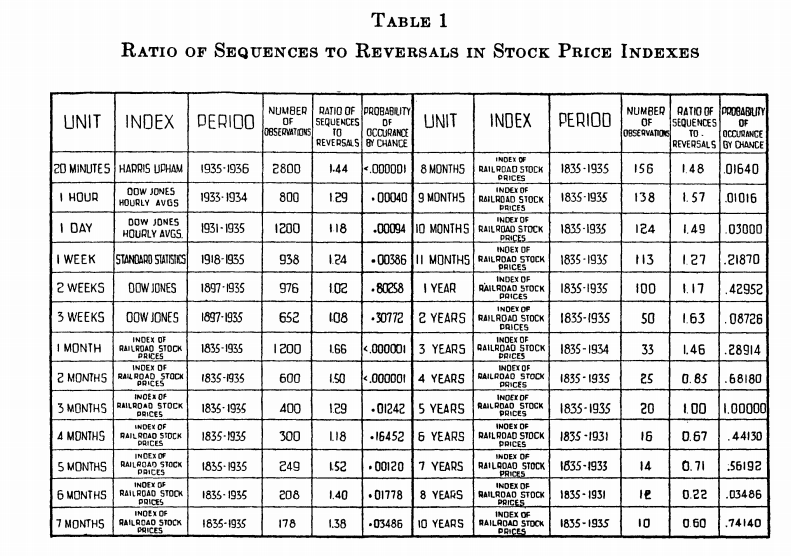
Momentum has been studied for many years and was officially documented by researchers in 1937 (h.t., Gary Antonacci).
Here is the chart from the original Econometrica paper:
The results are hypothetical results and are NOT an indicator of future results and do NOT represent returns that any investor actually attained. Indexes are unmanaged, do not reflect management or trading fees, and one cannot invest directly in an index. Additional information regarding the construction of these results is available upon request.
The authors document that “inertia” is significant in stock prices. The authors also highlight that they have limited data, and therefore, limited statistical power to assess longer term inertia. Well, we now have 200+ years of data to verify their claims.
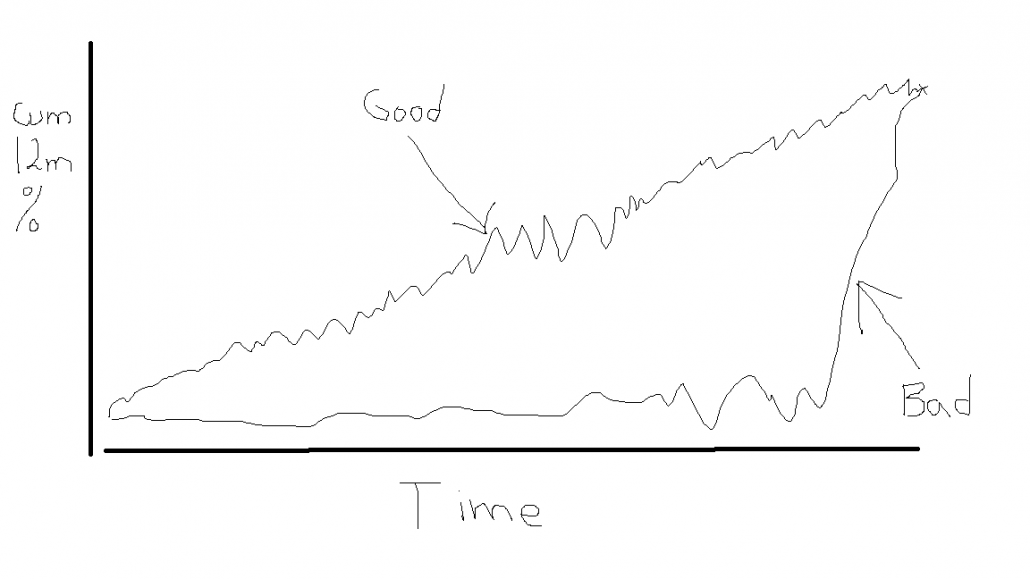
Remarkably, by simply reviewing the path by which momentum is achieved, as highlighted by the authors of the paper discussed above in this post, the momentum anomaly can be enhanced via concentration in those high momentum stocks with the highest quality, or most “continuous” momentum. (Note: An older paper from Grinblatt and Moskowitz (2004), finds a similar finding.)
To make this clear, I drew up a simple chart to highlight the concept.
The results are hypothetical results and are NOT an indicator of future results and do NOT represent returns that any investor actually attained. Indexes are unmanaged, do not reflect management or trading fees, and one cannot invest directly in an index. Additional information regarding the construction of these results is available upon request.
About the Author: Wesley Gray, PhD
—
Important Disclosures
For informational and educational purposes only and should not be construed as specific investment, accounting, legal, or tax advice. Certain information is deemed to be reliable, but its accuracy and completeness cannot be guaranteed. Third party information may become outdated or otherwise superseded without notice. Neither the Securities and Exchange Commission (SEC) nor any other federal or state agency has approved, determined the accuracy, or confirmed the adequacy of this article.
The views and opinions expressed herein are those of the author and do not necessarily reflect the views of Alpha Architect, its affiliates or its employees. Our full disclosures are available here. Definitions of common statistics used in our analysis are available here (towards the bottom).
Join thousands of other readers and subscribe to our blog.


