Fundamentally, Momentum is Fundamental Momentum
- Robert Novy-Marx
- A version of the paper can be found here.
- Want a summary of academic papers with alpha? Check out our Academic Research Recap Category.
Abstract:
Momentum in firm fundamentals, i.e., earnings momentum, explains the performance of strategies based on price momentum. Earnings surprise measures subsume past performance in cross sectional regressions of returns on firm characteristics, and the time-series performance of price momentum strategies is fully explained by their covariances with earnings momentum strategies…
Alpha Highlight:
In 1998, Barberis, Shleifer, and Vishny published a theoretical model on investor sentiment, which described the possibility that behavioral biases drive both the value and momentum anomalies. Value is essentially an overreaction to bad news; momentum is an underreaction to good news. In a 1996 empirical paper, Chan, Jegadeesh and Lakonishok find that the momentum anomaly is arguably driven, in part, by a sluggish response to past news:
Security analysts’ earnings forecasts also respond sluggishly to past news, especially in the case of stocks with the worst past performance. The results suggest a market that responds only gradually to new information.
In this paper, Novy-Marx seeks to dig a bit deeper into the fundamental reason why momentum strategies have historically outperformed. He finds that price momentum is a manifestation of the earnings momentum anomaly. In other words, the momentum anomaly works because investors systematically underreact to positive earnings surprises. Novy-Marx then shows that after controlling for earnings momentum, price-based momentum is no longer “anomalous.”
Price Momentum and Earnings Momentum:
Let’s first review the concept of price and earnings momentum, and how portfolios based these two strategies are formed:
- Price Momentum: Stocks with the strongest past performance tend to outperform those with the weakest past performance.
- Price momentum (r2,12) portfolios are formed based on the past 12 months performance, while ignoring the most recent month (thus the “r2” designation), to avoid short term reversals.
- Earnings Momentum: Stocks with strong past earnings surprises outperform those with weak past earnings surprises.
- Earnings momentum portfolios are formed based on past earnings surprises. Earnings surprise is measure two ways in this paper: standardized unexpected earnings (SUE) and Cumulative three day abnormal returns (CAR3).
Key Findings:
1. Earnings momentum drives price momentum.
This paper first runs cross-sectional and time-series regressions of firms’ returns on both past performance and earnings surprises. The results show that price momentum can be largely explained by earnings momentum.
Next, the author looks at 3 long/short factor portfolios: 1) price momentum variable is UMD, which is available from the Ken French data library and 2 earnings momentum variables, 2) SUE and 3) CAR3.
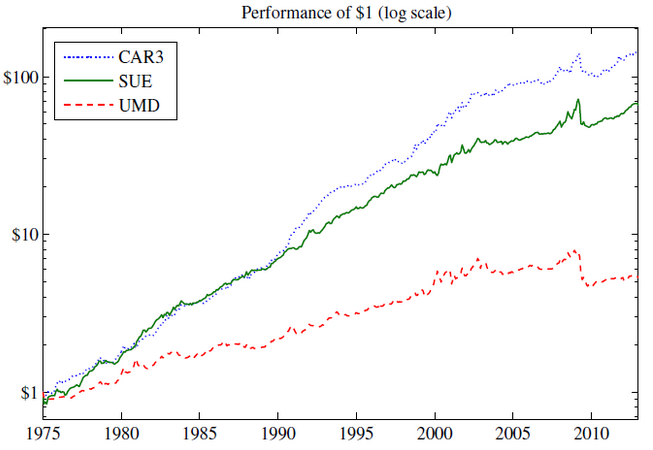
The below figure shows the performance of these three portfolios (all portfolios are long/short portfolios). We can see that both the earnings momentum strategies dramatically outperform the price momentum strategy!

The results are hypothetical results and are NOT an indicator of future results and do NOT represent returns that any investor actually attained. Indexes are unmanaged, do not reflect management or trading fees, and one cannot invest directly in an index. Additional information regarding the construction of these results is available upon request.
Table 2 (omitted here) shows the results of time-series regressions: Panel A (3) shows that UMD loads heavily on both SUE and CAR3. A couple of interesting findings: First, after controlling for earnings momentum and 3 FF factors, price momentum’s alpha turns out to be negative! The effect seems to be gone. Panel B and C show that the earnings momentum factors’ alphas are still highly significant after controlling for the other factors. So the paper concludes that earnings momentum “subsumes” price momentum, since it seems to explain the entire effect.
2. Controlling for earnings surprises when constructing price momentum strategies will significantly worsen the performance.
In the next section, the paper constructs conditional momentum strategies that control for one variable, while sorting on the other. For example:
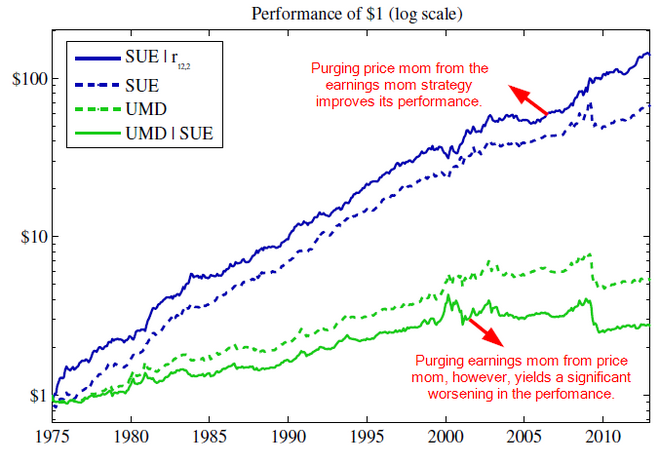
- UMD|SUE (“UMD conditional on SUE”): means purging earnings momentum from price momentum.
- SUE|r2,12 (“SUE conditional on prior year’s performance”): means purging price momentum from earnings momentum.
Figure 3 below shows the performance of the four strategies: SUE|r2,12 performs better than SUE alone, which means that excluding the price momentum factors from earnings momentum improves its performance! So perhaps earnings momentum is a “purer” momentum signal? Meanwhile purging earnings momentum from price momentum worsens the performance…

The results are hypothetical results and are NOT an indicator of future results and do NOT represent returns that any investor actually attained. Indexes are unmanaged, do not reflect management or trading fees, and one cannot invest directly in an index. Additional information regarding the construction of these results is available upon request.
3. Controlling for price momentum when constructing earnings momentum strategies can help reduce volatility, and eliminate crashes to a large extent.
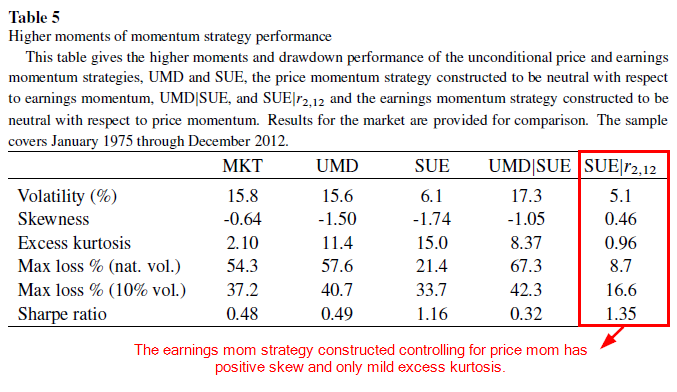
The momentum strategy is known for being sensitive to market cycles (Chordia and Shivakumar, 2001) and is more volatile in poor market environments (Daniel and Moskowitz, 2013). In this paper, the authors discover that the volatility associated with momentum can be largely reduced if we control for price momentum when we construct earnings momentum. The Table below shows that both UMD and SUE have large negative skewness and a large max loss. However, SUE|r2,12 has positive skewness and much smaller excess kurtosis! It also has the highest Sharpe ratio. Very interesting…

The results are hypothetical results and are NOT an indicator of future results and do NOT represent returns that any investor actually attained. Indexes are unmanaged, do not reflect management or trading fees, and one cannot invest directly in an index. Additional information regarding the construction of these results is available upon request.
Conclusions:
This is an interesting paper and the findings highlight that momentum is driven by what seems to be an underreaction to fundamentals — this is in line with the predictions of behavioral theorist that hypothesize that momentum may be driven by an underreaction to good news. In the case of this paper, “good news” is unexpected earnings surprises — investors apparently underreact to this information. A stronger conclusion from the paper is that after controlling for the market’s underreaction to unexpected earnings surprises, price-based momentum is no longer a useful stock-selection indicator. This evidence contradicts the analysis from Chan, Jegadeesh and Lakonishok. So perhaps the truth lies somewhere in between…
Note: Jack has conducted a full reverse engineering and assessment of the claims made in this paper. We dedicate an entire chapter to this analysis and follow-on research in our upcoming book, Quantitative Momentum. But we’ll bite our tongues for now, but let’s just say that we are skeptical of many of the claims in this paper, which rely on complex and unrealistic long/short portfolio constructs to drive the results. When one examines the long and short legs, separately, the story changes…
About the Author: Wesley Gray, PhD
—
Important Disclosures
For informational and educational purposes only and should not be construed as specific investment, accounting, legal, or tax advice. Certain information is deemed to be reliable, but its accuracy and completeness cannot be guaranteed. Third party information may become outdated or otherwise superseded without notice. Neither the Securities and Exchange Commission (SEC) nor any other federal or state agency has approved, determined the accuracy, or confirmed the adequacy of this article.
The views and opinions expressed herein are those of the author and do not necessarily reflect the views of Alpha Architect, its affiliates or its employees. Our full disclosures are available here. Definitions of common statistics used in our analysis are available here (towards the bottom).
Join thousands of other readers and subscribe to our blog.

