Meb Faber’s twitter feed is a great source to find new research ideas — his followers are very curious.

Today, someone asked about the P/E of mega-cap firms relative to the broader market.
Yang fired up his Bloomberg, conducted some quick excel ninja tactics, and generated the following chart:
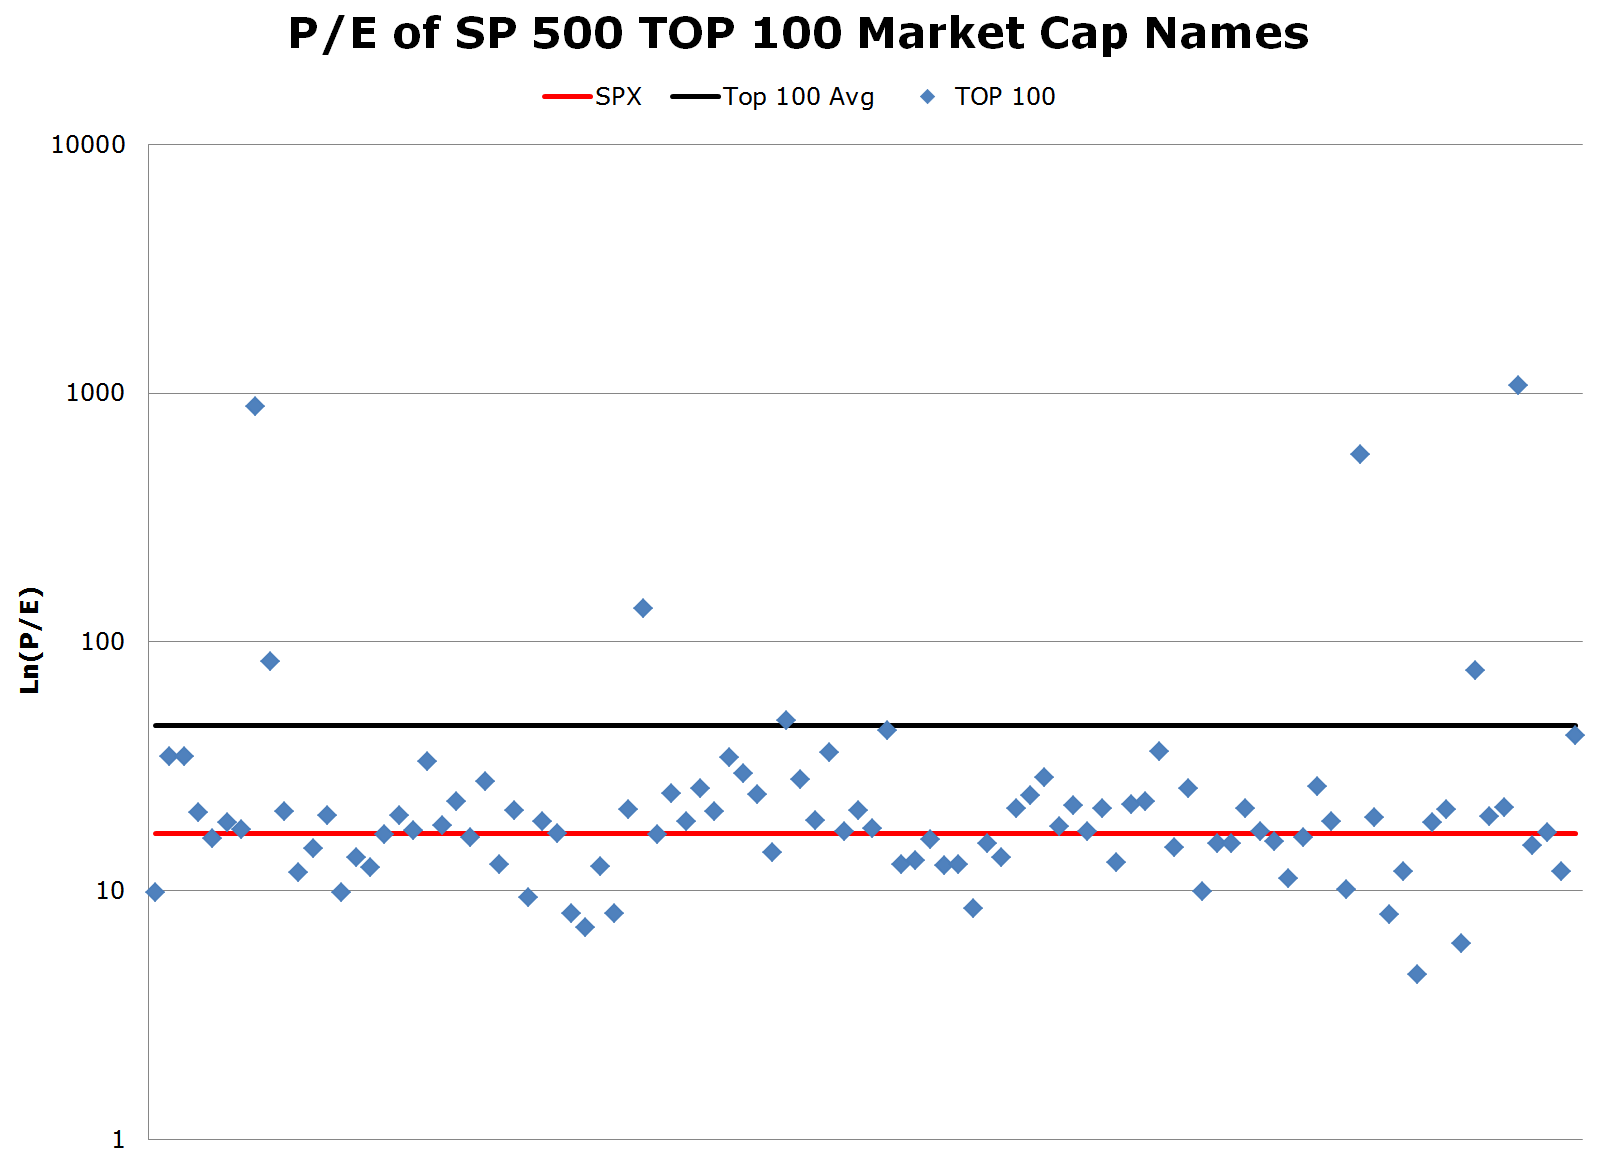
Takeaways:
- The S&P 500 value-weighted P/E is 16.97
- The average P/E of the top 100 names by market cap is 46.16 (skewed by some extreme valuations on firms like Amazon)
- The plot highlights that aside from extreme valuations on a handful of firms, mega-cap valuations aren’t that different than the S&P 500 (which makes sense because they make up the vast majority of the S&P 500’s market cap).

About the Author: Wesley Gray, PhD
—
Important Disclosures
For informational and educational purposes only and should not be construed as specific investment, accounting, legal, or tax advice. Certain information is deemed to be reliable, but its accuracy and completeness cannot be guaranteed. Third party information may become outdated or otherwise superseded without notice. Neither the Securities and Exchange Commission (SEC) nor any other federal or state agency has approved, determined the accuracy, or confirmed the adequacy of this article.
The views and opinions expressed herein are those of the author and do not necessarily reflect the views of Alpha Architect, its affiliates or its employees. Our full disclosures are available here. Definitions of common statistics used in our analysis are available here (towards the bottom).
Join thousands of other readers and subscribe to our blog.