We’ve discussed return seasonalities in the past, especially as they pertain to our approach to momentum. Turns out seasonality effects aren’t confined to momentum — they are literally everywhere and they are incredibly strong.
This paper will blow your mind once you let the results settle in a bit.
Turns out stock returns are lumpy across the calendar. Stocks don’t earn “average” returns each month, they earn a lot of return in some months and little to no returns in other months…and this pattern is predictable, persistent, and powerful.
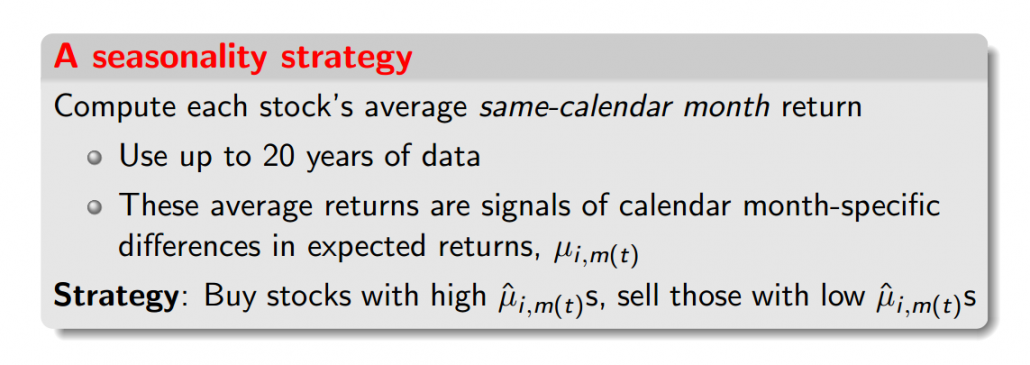
Here is an image from the authors the explains the basic idea:
Abstract:
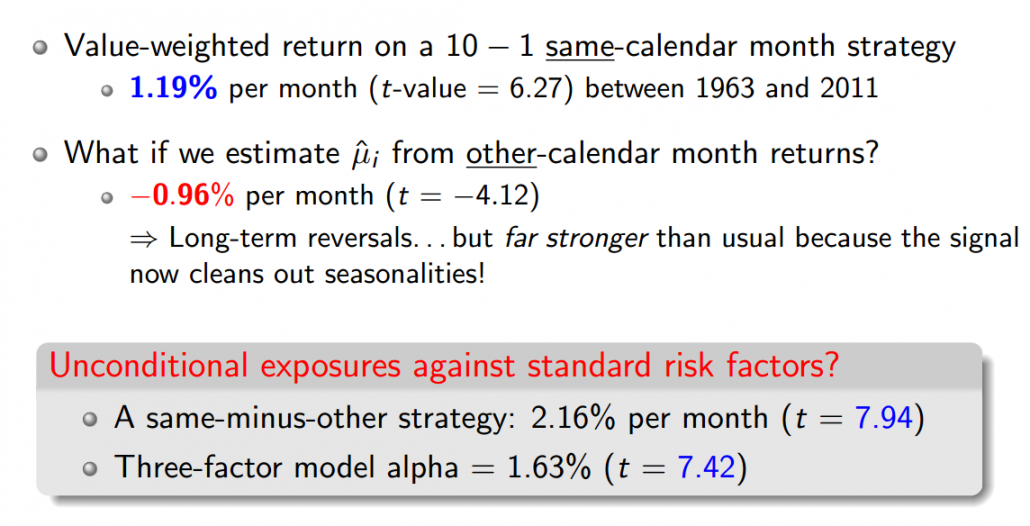
A strategy that selects stocks based on their historical same-calendar-month returns earns an average return of 13% per year. We document similar return seasonalities in anomalies, commodities, international stock market indices, and at the daily frequency. The seasonalities overwhelm unconditional differences in expected returns…
Instead of focusing on particular characteristics to form portfolios (cheap, high mom, low vol, quality, etc.) one can simply form portfolios based on their performance during a particular month.
Here are their bottomline results:

The results are hypothetical results and are NOT an indicator of future results and do NOT represent returns that any investor actually attained. Indexes are unmanaged, do not reflect management or trading fees, and one cannot invest directly in an index. Additional information regarding the construction of these results is available upon request.
Interesting, to say the least…more to come on this subject. The R&D engines will be roaring this summer.
About the Author: Wesley Gray, PhD
—
Important Disclosures
For informational and educational purposes only and should not be construed as specific investment, accounting, legal, or tax advice. Certain information is deemed to be reliable, but its accuracy and completeness cannot be guaranteed. Third party information may become outdated or otherwise superseded without notice. Neither the Securities and Exchange Commission (SEC) nor any other federal or state agency has approved, determined the accuracy, or confirmed the adequacy of this article.
The views and opinions expressed herein are those of the author and do not necessarily reflect the views of Alpha Architect, its affiliates or its employees. Our full disclosures are available here. Definitions of common statistics used in our analysis are available here (towards the bottom).
Join thousands of other readers and subscribe to our blog.


