Readers,
We’re working on some internal tools to help investors make more informed decisions.
The primary challenge that investors face is understanding what they are actually buying versus what they are being sold.
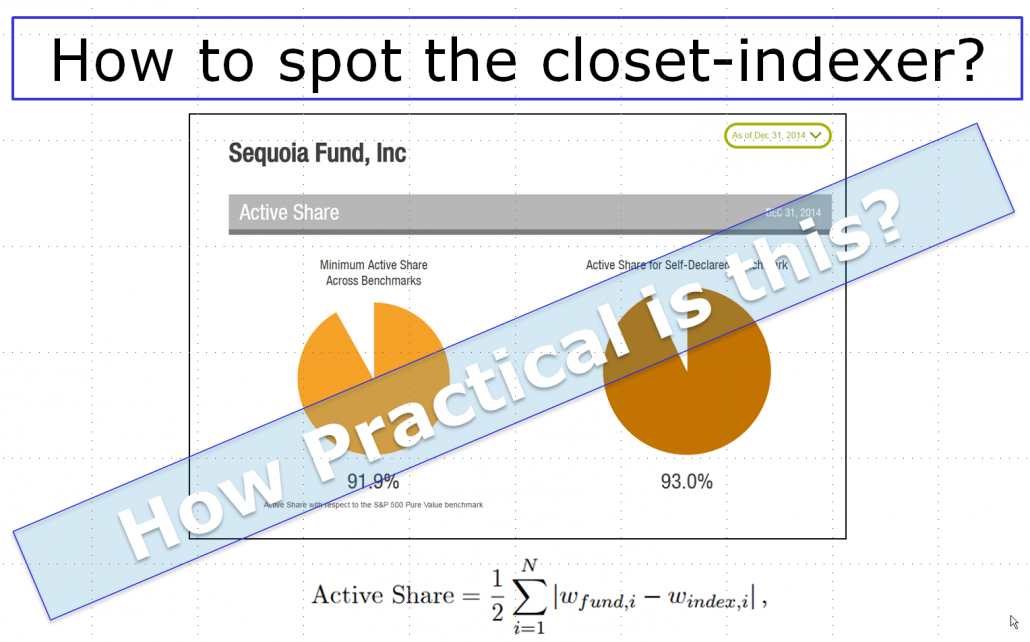
Active share and high level portfolio statistics (e.g., holdings or 3×3 valuation/size charts) are marginally useful.
But what is really useful is a holdings-level characteristics-focused visualization tool that a marketing department cannot hide behind. Our tool will help you quickly and intelligently ascertain what you are buying versus what you are being sold.
Next week I’ll walk through the concept via an Interactive Brokers webinar.
If you’d like to check out, the details are below. Look forward to seeing you on the webinar and answering any questions you might have regarding the tool.
So How Do I Sign Up for the Webinar?
Date and Time: Monday, June 27, 2016 12:00 pm, Eastern Daylight Time (New York)
- Event Entrance for Attendees: https://interactivebrokers.
webex.com/interactivebrokers/ onstage/g.php?MTID= ec3b8bd01f40f846886eae727d5c2e 675 - Teleconference: Call-in toll-free number (US/Canada): 1-866-469-3239
- Call-in toll number (US/Canada): 1-650-429-3300
Additional Information:
Global call-in numbers: https://interactivebrokers.
Toll-free dialing restrictions: https://www.webex.com/pdf/
Access code: 717 218 697
Event Number: 717 218 697
About the Author: Wesley Gray, PhD
—
Important Disclosures
For informational and educational purposes only and should not be construed as specific investment, accounting, legal, or tax advice. Certain information is deemed to be reliable, but its accuracy and completeness cannot be guaranteed. Third party information may become outdated or otherwise superseded without notice. Neither the Securities and Exchange Commission (SEC) nor any other federal or state agency has approved, determined the accuracy, or confirmed the adequacy of this article.
The views and opinions expressed herein are those of the author and do not necessarily reflect the views of Alpha Architect, its affiliates or its employees. Our full disclosures are available here. Definitions of common statistics used in our analysis are available here (towards the bottom).
Join thousands of other readers and subscribe to our blog.