Jegadeesh and Titman (1993) popularized a simple idea: “past winners outperform past losers.” Post JT, the relative strength, or “momentum anomaly,” was forever ingrained in the minds of academic researchers (which is odd, since the idea had been around 50 years prior to JT 1993, but I digress…).
Later studiies–see Meb Faber, Gary Antonacci, or the new Haghani and Dewey papers for examples–have suggested that momentum can be useful for tactical asset allocation. A more formal research piece was conducted by Lewellen (2002), who explores the use of momentum for style timing across size and value portfolios.
This all sounds great, but how about another out-of-sample test?
A relatively recent paper by Docherty and Chan (2012) crossed our desk and further explores questions related to the use of “style momentum” in Australia.
- Does style momentum exist?
- What are the sources of style momentum?
What Exactly is Style Momentum and How Does it Perform in Australia?
Tactical investors believe that the returns in different styles are dynamic, and rotating between styles (small cap value, small growth, large cap growth, etc) based on momentum can improve performance.
The authors re-examine the style momentum in size and B/M portfolios. How to construct momentum portfolios with styles? …in Australia…
In their paper, the authors use two methods to construct style portfolios for robustness checks: the traditional methodology (Jegadeesh and Titman, 1993) and the method developed by Brailsford, Gaunt and O’Brien (2012).
For brevity reasons, we only introduce the traditional method in this summary:
- Each December, all stocks are double-sorted based on their market cap and B/M ratio. Thus, there are total 25 (ie., 5*5) portfolios based on both characteristics. To avoid look-ahead bias, only firms with a balance date at least six months prior to portfolio formation are included.
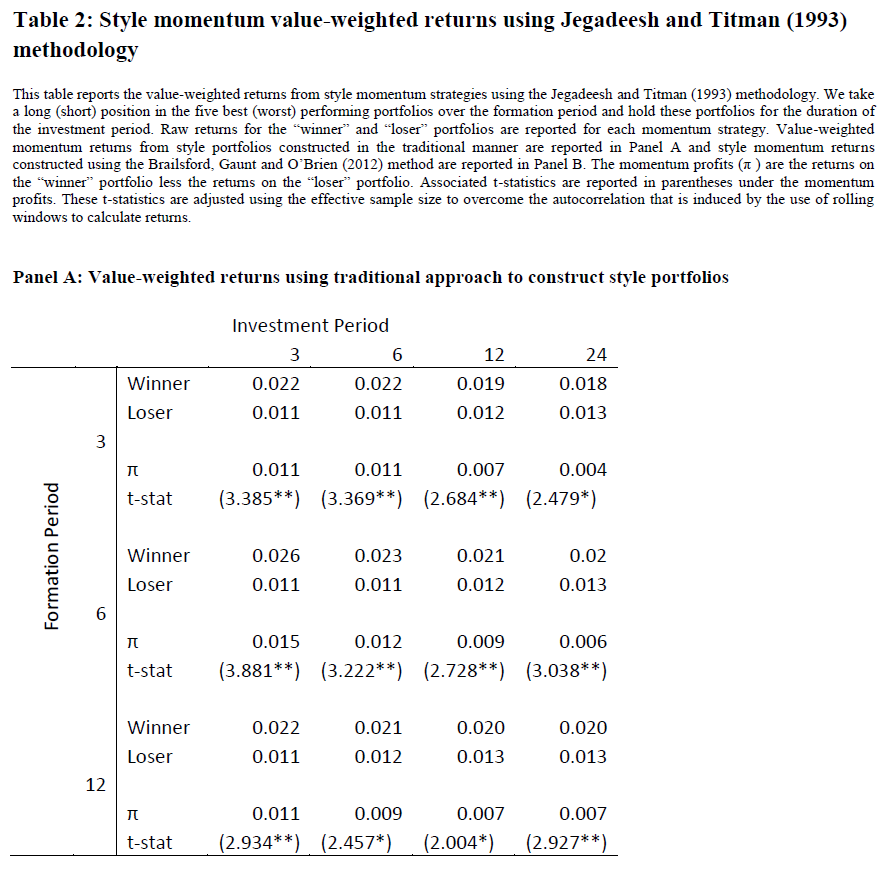
- Take a long (short) position in the top (bottom) five style portfolios based on the returns across the formation period. Style momentum strategies are examined for formation periods of 3, 6, and 12 months and investment periods of 3, 6, 12 and 24 months.
The sample in this paper are all Australian stocks in the AGSM database from 1975 to 2008. Table 2, Panel A (see below) shows the value-weighted returns using traditional approach. The results show that all of the style momentum strategies based on different formation periods and investment periods generate significant momentum profits. What’s more, style momentum returns persist after controlling for the Fama and French (1993) factors. So, Docherty and Chan (2012) conclude that style momentum does exist, theoretically.

The results are hypothetical results and are NOT an indicator of future results and do NOT represent returns that any investor actually attained. Indexes are unmanaged, do not reflect management or trading fees, and one cannot invest directly in an index. Additional information regarding the construction of these results is available upon request.
Takeaways
Style momentum strategies are becoming more and more viable with lower trading costs and the fast growth of ETFs with targeted exposure. Readers should explore these models and share results with our community. Best of luck!
Momentum in Style Portfolios: Risk or Inefficiency?
- Docherty and Chan
- Want a summary of academic papers with alpha? Check out our Academic Research Recap Category.
Abstract:
Momentum is a pervasive asset-pricing anomaly that has been shown to exist in a number of markets and asset classes. Three possible explanations for momentum have emerged in the literature; risk, positive autocorrelation and negative cross-serial correlation. Lewellen (2002) adds to this literature by providing evidence of strong momentum returns in style portfolios that can be explained by negative cross-serial correlation. However, a critique of this explanation by Chen and Hong (2002) argues that it is driven by the methodology used to decompose momentum returns and the in-sample negative autocorrelation within the market. Our paper examines style momentum in a market that exhibits positive auto-correlation across our sample period. We use an alternative empirical framework and test whether style momentum may be explained by different phenomena when the formation and investment periods are varied. We report no evidence to support negative cross-serial correlation but evidence to support momentum in style portfolios that can be explained by autocorrelation over short horizons, supporting the under-reaction hypothesis. However, we show that autocorrelation decreases when longer periods are used to form portfolios, resulting in expected returns substantively explaining returns over a 12-month horizon.
About the Author: Wesley Gray, PhD
—
Important Disclosures
For informational and educational purposes only and should not be construed as specific investment, accounting, legal, or tax advice. Certain information is deemed to be reliable, but its accuracy and completeness cannot be guaranteed. Third party information may become outdated or otherwise superseded without notice. Neither the Securities and Exchange Commission (SEC) nor any other federal or state agency has approved, determined the accuracy, or confirmed the adequacy of this article.
The views and opinions expressed herein are those of the author and do not necessarily reflect the views of Alpha Architect, its affiliates or its employees. Our full disclosures are available here. Definitions of common statistics used in our analysis are available here (towards the bottom).
Join thousands of other readers and subscribe to our blog.

