Sometimes even the best evidence-based active investment strategies can create a formidable challenge to investors seeking to exploit them.
Case in point — momentum investing.
On the one hand, stock-selection momentum strategies (here is a link to more information) can have the potential to generate excess expected returns over the long run; on the other hand, these strategies sometimes generate massive amounts of investor pain when they inevitably go through long bouts of poor relative performance. It’s a kind of quid pro quo: in order to access the potential gain, you must willing to accept the potential pain.
We’ve spent many years (even wrote a book on the subject) developing our own whiz-bang momentum investing program, Quantitative Momentum, and guess what? Same outcome: no pain, no gain. But as long-term investors looking to capture a sustainable edge, we embrace this pain. If momentum were easy, everyone would be doing it and the strategy would not be as attractive.
But how much momentum investing pain can one expect?
Among the academic anomalies, the momentum effect generate the most attractive expected returns, but also suffers bouts of horrific underperformance (i.e., “crashes”). These crashes are legendary among academics and practitioners alike. The relative underperformance is even worse than those associated with deep value strategies. But relative “underperformance” is an abstract term. Just how bad can the “pain and anguish” associated with momentum investing actually get?
In a remarkable paper recently published in the FAJ, “Two Centuries of Price-Return Momentum,” by Chris Geczy and Mikhail Samonov, the authors examine an extremely long time series to see just how painful things have gotten in the past for momentum investors. (Here is an older version: 212 Years of Price Momentum (The World’s Longest Backtest: 1801–2012). The paper conducts an incredible “out of sample” backtest on the so-called cross-sectional momentum phenomenon, which is traditionally measured via a L/S stock portfolio that goes long winners and short losers.
10 years of underperformance. Are you prepared?
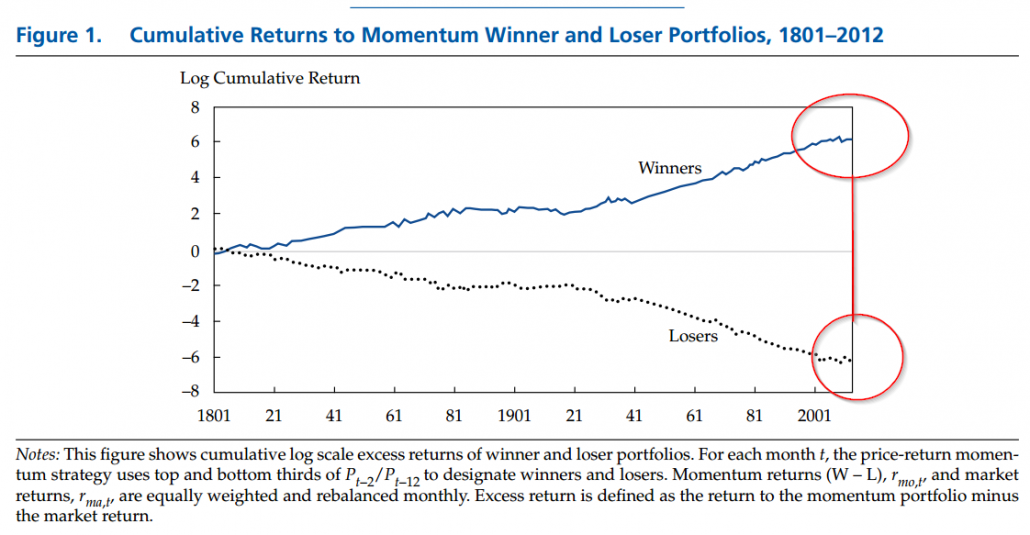
First, let’s look at the cumulative returns associated with the excess return performance of winners and losers. Of course, this chart shouts the question: “Why isn’t everyone doing this?”

The results are hypothetical results and are NOT an indicator of future results and do NOT represent returns that any investor actually attained. Indexes are unmanaged, do not reflect management or trading fees, and one cannot invest directly in an index. Additional information regarding the construction of these results is available upon request.
If you’ve read this blog enough you already know the answer as to why everyone else isn’t doing this…IT SUCKS.
But let me qualify that statement.
“It sucks” to actually own this portfolio in a world where relative performance inflicts pain and we invest on a time scale that is day-to-day, week-to-week, and month-to-month. The long-horizon chart above doesn’t highlight the actual short-term pain associated with sticking to a strategy that lags the broad index for multiple years. The general term for this phenomenon is “time dilation” and Ben Carlson has a nice piece on it. Here is another interesting piece if you want to geek out a bit.
So is momentum investing dead?
We hear a lot of investors talking about the death of various active strategies because they must have “stopped working.” And while it is possible that a strategy can stop working, there is a certain irony to these claims — they can actually reinforce why a strategy will be sustainable in the future. We discuss this odd reality in our sustainable active investing framework.
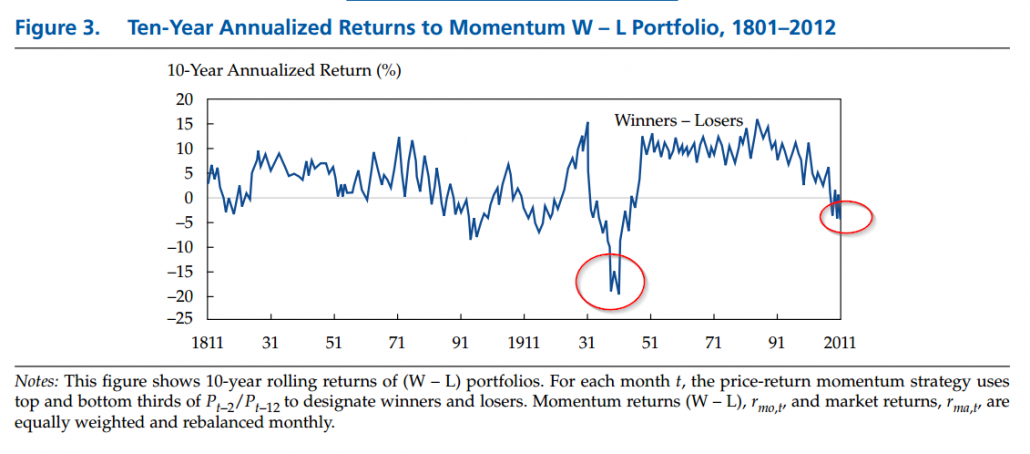
Prior to 2009, the only major long-term loser period for a long/short momentum strategy was during the Great Depression era, when the strategy had 10 years of compounded negative returns (and boy was it ugly!). The chart below shows 10-year rolling returns for a long/short momentum strategy, and demonstrates how painful it would have been to be a momentum investor in those days:

The results are hypothetical results and are NOT an indicator of future results and do NOT represent returns that any investor actually attained. Indexes are unmanaged, do not reflect management or trading fees, and one cannot invest directly in an index. Additional information regarding the construction of these results is available upon request.
Ouch! Being a momentum investor painful over the last decade. I guess all the supercomputers, factor investors, and quant PhDs screwed it up? Maybe. But did the supercomputers, factor investors, and quant PhDs screw it up in the 1930’s as well? Unlikely. The reality is that a decade of underperformance is not especially rare for momentum investors — as this paper highlights, it is actually pretty common. Again, no pain, no gain. Note that in three separate decades (ending 1890, 1900, and 1920) long/short momentum portfolios generated negative returns.
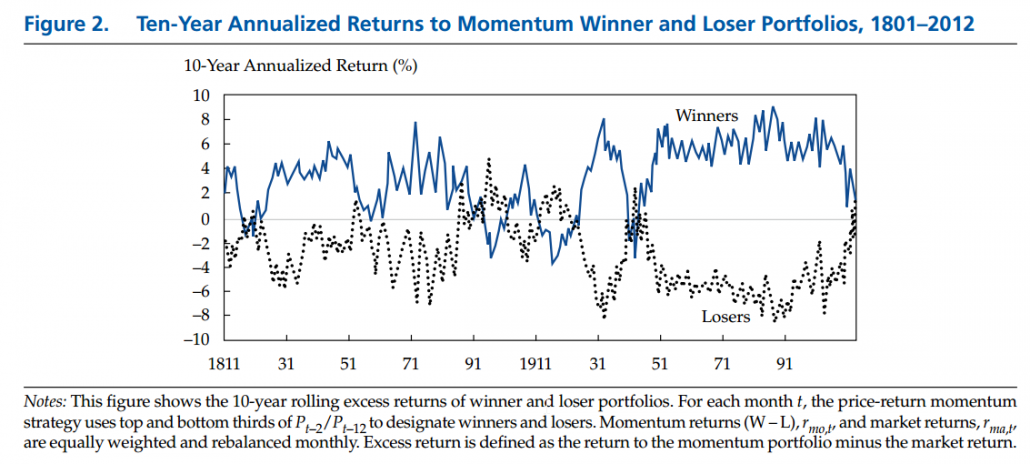
The last decade has also been rough for long/short momentum. From January 2002 to December 2012, the annualized spread between long and short portfolios was -2.1%. The chart below shows how 10-year rolling spreads collapsed in recent years (and went negative by 12/2012) and breaks the results out by the long leg and the short leg of the portfolio. Similar to episodes of L/S underperformance in the past, momentum pain is caused when buying winners stinks and buying losers turns out to be a winners game!

The results are hypothetical results and are NOT an indicator of future results and do NOT represent returns that any investor actually attained. Indexes are unmanaged, do not reflect management or trading fees, and one cannot invest directly in an index. Additional information regarding the construction of these results is available upon request.
The figure above also highlights that a long-only momentum investor (blue line in the “figure 2” above) will also have to suffer periods of long underperformance to reap the benefits of momentum. There are are multiple periods of 10-year relative underperformance for a long-only momentum investor. That really stinks, but for those with the discipline to stick with the program, they were rewarded with compound annual growth rates that would put an investor in very rare company.
Momentum probably isn’t dead, but momentum investing IS painful
Saying that momentum investing — the undisputed king of market anomalies identified by academic researchers — is “dead,” based on the fact the strategy has underperformed over the past 5-10 years, is akin to saying to that Michael Phelps is a terrible swimmer because he didn’t win an olympic medal in one of his races. Momentum is the research-consensus champion when it comes to the stock anomaly race, but that doesn’t mean it wins the race all of the time. In fact, momentum has historically gotten its face ripped off many times over relative to the passive buy and hold market. But horrific relative pain is something to be expected for robust “open secret” anomalies. Trying to arbitrage long duration anomalies like momentum requires a discipline and dedication that are extraordinary and uncommon and therefore, we can expect that these strategies will be successful in the future (at least relative to strategies that currently have Sharpe ratios of 3+ and never lose). In contrast, if a strategy mints money every day relative to the market and never creates pain, there can never be a sustainable gain. These “too good to be true” situations lead to rich proprietary trading groups, Madoff scams, hidden tail risks, and hyper-active portfolio transitions — none of these outcomes are positive for the long-term taxable investor that doesn’t run a super-computer filled room with math and physics PhDs trading their own capital.
But we’ll leave the last words to the authors:
The most recent underperformance [of momentum] raised practical questions about the “anomalous outlier” assumption and what the actual distribution of momentum profits is, which by their nature have influenced and will continue to influence theory about this powerful characteristic in returns. By extending our analysis of equity momentum returns to 1801, we have created a more complete picture of the potential outcomes of momentum strategy returns. In doing so, we discovered seven additional decade-long negative periods before the Great Depression.
Bottom line: Historical profits associated with momentum investing are real and anyone denying this fact may want to reconsider the broad body of research on the topic. However, on the flip side, those who claim that momentum investing is “easy” are denying the reality that active momentum investing is quite possibly the most painful anomaly to exploit. (not to mention the scalability might be limited, but this is another debate).
Editor note: one can replace “momentum” with “value” throughout the post without loss of integrity.
About the Author: Wesley Gray, PhD
—
Important Disclosures
For informational and educational purposes only and should not be construed as specific investment, accounting, legal, or tax advice. Certain information is deemed to be reliable, but its accuracy and completeness cannot be guaranteed. Third party information may become outdated or otherwise superseded without notice. Neither the Securities and Exchange Commission (SEC) nor any other federal or state agency has approved, determined the accuracy, or confirmed the adequacy of this article.
The views and opinions expressed herein are those of the author and do not necessarily reflect the views of Alpha Architect, its affiliates or its employees. Our full disclosures are available here. Definitions of common statistics used in our analysis are available here (towards the bottom).
Join thousands of other readers and subscribe to our blog.


