As we have mentioned before, here, here and here, there is overwhelming evidence that the number of stock anomalies in the universe is much lower than originally thought. Most of the previous research papers attempt to filter out past anomalies in the literature (generally over 300+) by applying more stringent standards, such as higher p-values or more advanced statistical tests.
A working paper we examine below, “p-hacking: Evidence from two million trading strategies” by Chordia, Goyal and Saretto, takes an alternative approach. The authors take the Compustat universe of data points, and use every variable in the dataset to create over 2 million trading strategies — explicit data-mining!
The idea behind the paper is to examine what is possible if one simply data-mined the entire universe of signals. The authors make an effort to only examine tradeable strategies by eliminating small and micro-cap stocks. In addition, the authors apply more stringent statistical standards (which I will discuss below) to identify the true anomalies in the data.
After examining all the signals, the authors find only a handful of trading strategies that are “anomalous” and most of these strategies make no economic sense! Now the authors do assume (through their tests), that the Fama and French 5-factor model plus momentum explain the cross-section of stock returns (so all the classic characteristics we all argue about are controlled for in the study), but the author’s main contribution is that there is little to no evidence for additional anomalies.
However, many papers have already found this. So why is this paper important?
A newer topic that we are commonly asked about is machine learning. Many are intrigued by the idea — let the computer with its algorithms come up with the best trading signals using all the data. At first, this sounds great (and in certain contexts can be extremely useful). But taking a step back, we need to examine what happens if we simply examine all the data. This paper highlights that trading on every signal in the fundamental-signal universe yields almost no (additional) anomalies.(1)
It may be the case that machine-learning is great at combining the already well-known anomalies that the authors assume in the paper (such as Value and Momentum); however, machine-learning may also end up enhancing frictional costs and increasing the chances of a data-mined result (despite the algorithms best efforts to avoid this problem).
Below we dig into the details of the paper.
The data
The paper examines the idea of finding anomalies in a different manner than most — it simply data mines.
Here is the high-level summary from the paper:
We consider the list of all accounting variables on Compustat and basic market variables on CRSP. We construct trading signals by considering various combinations of these basic variables and construct roughly 2.1 million different trading signals.
Two additional screens that I like from that paper are that they (1) eliminate all firms with stock prices below $3 as well as those below the 20th percentile for market capitalization and (2) require all the variables to have information to include the firm in the sample.(2)
The paper then examines the 156 variables in the Compustat library (listed in Appendix A1 of the paper) to create over 2 million trading signals. Here is how the signals are constructed, directly from the paper:
There are 156 variables that clear our filters and can be used to develop trading signals. The list of these variables is provided in Appendix Table A1. We refer to these variables as Levels. We also construct Growth rates from one year to the next for these variables. Since it is common in the literature to construct ratios of different variables we also compute all possible combinations of ratios of two levels, denoted Ratios of two, and ratios of any two growth rates, denoted Ratios of growth rates. Finally, we also compute all possible combinations that can be expressed as a ratio between the difference of two variables to a third variable (i.e., (x1 − x2)/x3). We refer to this last group as Ratios of three. We obtain a total of 2,090,365 possible signals.
Since the paper has already eliminated small and micro cap stocks from the tests, they form portfolios using a one-dimensional sort on each of the variables. The portfolios are rebalanced annually, creating long/short portfolios that go long the top decile on each measure, and short the bottom decile.
The paper tests these 2 million portfolios by (1) regressing the L/S portfolio returns against the Fama and French 5-factor model plus the momentum factor and (2) examining Fama-MacBath (FM) regressions.
The Tests and Results
Before getting into the specific results, a good exercise (especially when data-mining) is to simply examine the distribution of outcomes. Figure 1 (shown below) in the paper shows the distributions and t-stats.
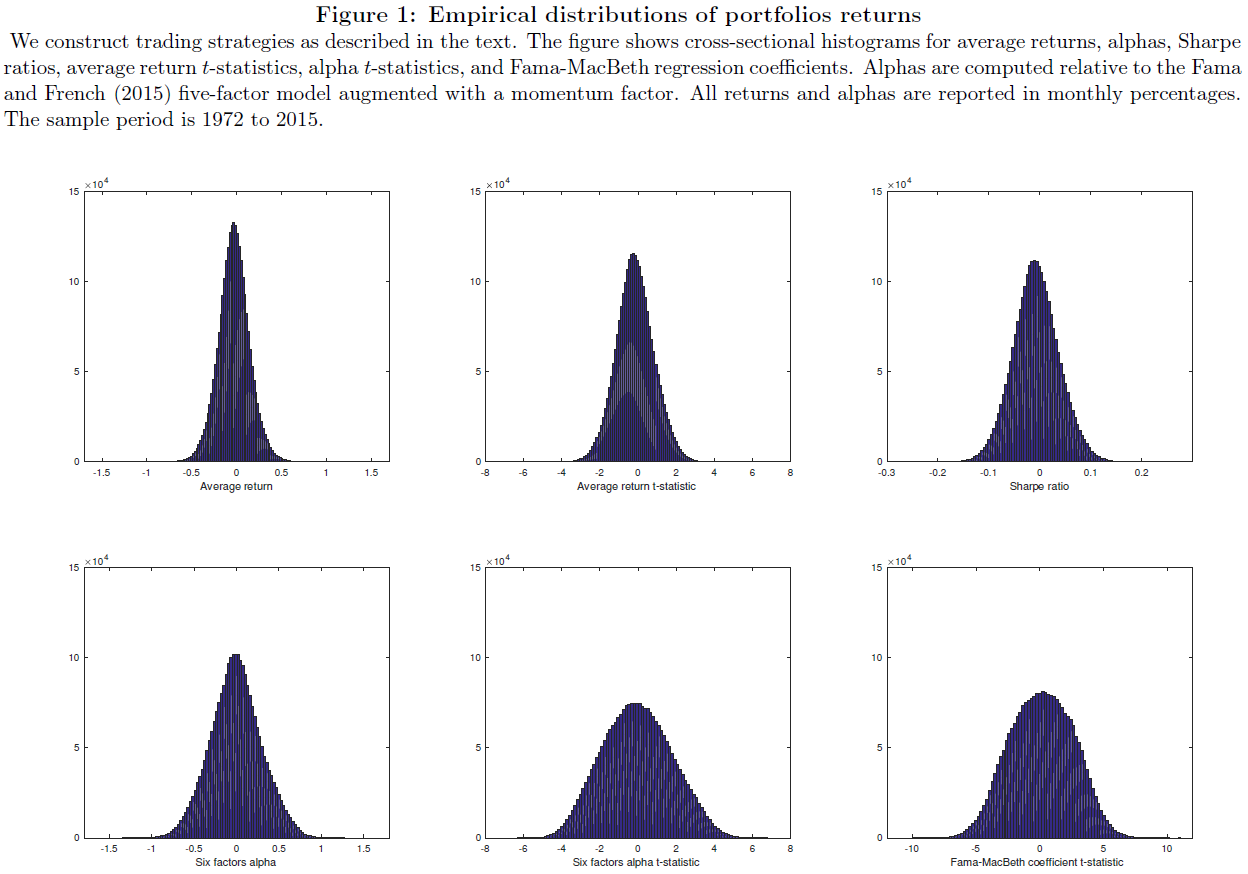
As viewed from the distributions, most are centered around 0.(3)The question is as follows: how robust are these trading strategies with significant alphas and Fama-MacBeth coefficients?
Examining raw returns first, the paper finds 22,237 portfolios with T-stats above 2.57 (in absolute value) — this is less than 1% of the total portfolios. Next, the paper examines the 6-factor regressions and finds that around 31% of the sample has a significant alpha at that 5% level, and 17% of the sample are significant at the 1% level. Last, examining the Fama-MacBeth regressions, the paper finds similar results — 31% of the sample has a t-stat above 1.96, and 18% of the sample has a t-stat above 2.57.
Based on these independent tests (alphas and FM regressions), the results are promising. However, the authors dig into the statistics with more advanced tests.
The reason to do this, as we discussed here before, is that as the number of ideas (in our case, 2 million) increases, the probability of Type 1 Errors increases. The authors describe this well in their paper:
Classical single hypothesis testing uses a significance level
to control Type I error (discovery of false positives). In multiple hypothesis testing (MHT), using
 to control Type I error (discovery of false positives). In multiple hypothesis testing (MHT), using
 The authors test and discuss this multiple hypothesis testing framework in Section 3 of the paper and the results are documented in Table 4.(4) However, false discoveries can still occur (by definition the tests allow this). To correct for this, the authors impose economic hurdles.
The hurdles are listed below:
- The strategy must be statistically significant for both the (1) 6-factor regression and (2) the Fama-MacBeth regression.
- The strategy must have a Sharpe ratio above the market’s over the time period studied, as well as in both sub-samples (splitting the dataset in two)
The full results (using multiple tests) are in Table 5 of the paper. The authors summarize the findings here:
In summary, in the most optimistic scenario where we consider the least stringent BHYS approach (and, therefore, neglect to account for cross-correlation in the data), we find at most 345 economically significant strategies (52 if we impose some persistence in economic performance). In the least optimistic scenario using the FWER approach, we find 5 strategies. If we properly account for the statistical properties of the data-generating process and use the FDP approach, we are left with a handful of exceptional investment opportunities. If we adopt an all-together conservative approach and control FDP at
= 1% (i.e., we accept one per cent of lucky discovery among all discoveries on average or in our sample), we reject all the two million strategies.
 = 1% (i.e., we accept one per cent of lucky discovery among all discoveries on average or in our sample), we reject all the two million strategies.
So high-level, very few strategies are significant using the authors’ test requirements!
A natural question is what are the strategies that survive, and do they make sense?
The authors examine some of the strategies in Table 6 of the paper (shown below):
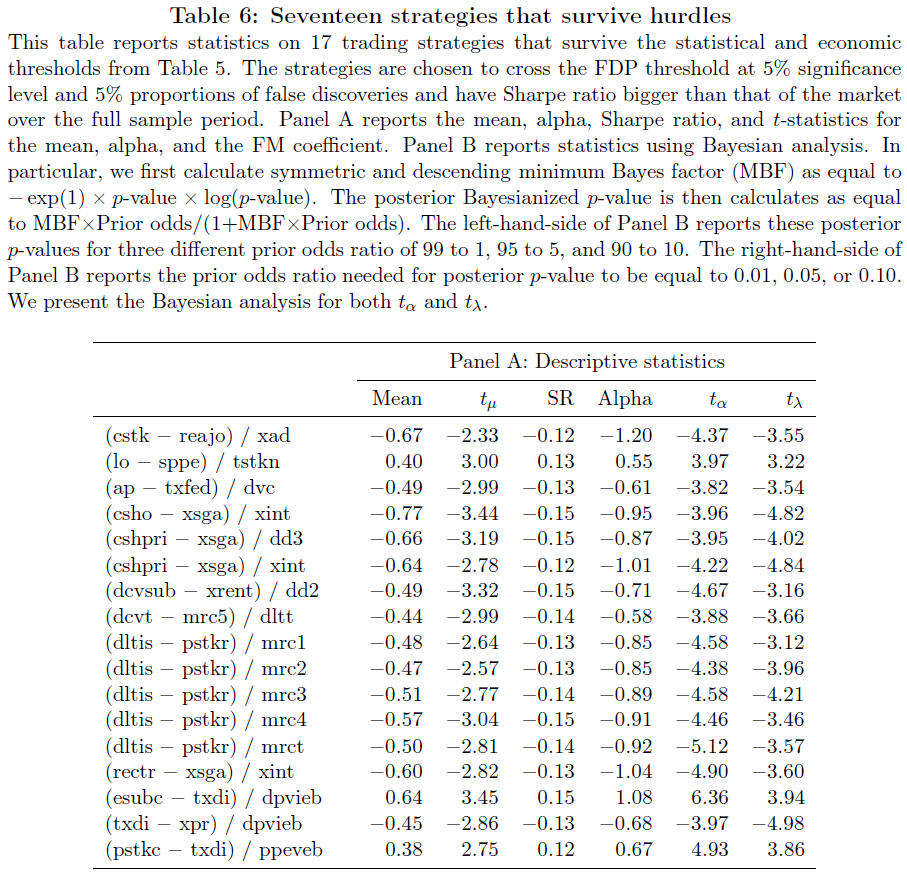
The 17 strategies in this Table are all different than the 447 strategies tested in Replicating Anomalies (2017) by Hou, Xue, and Zhang. For those who aren’t used to using Compustat variables, a list of the names can be found here. So examining the first strategy above (that is statistically significant) the proposed strategy is to sort stocks on Common/Ordinary Stock (cstk) minus Retained Earnings/Other Adjustments (reajo) divided by Advertising Expense (xad).
The majority of the other strategies above are just as absurd (have fun with the Compustat definition link!).
Conclusion
Overall, this paper examines what is possible if one simply data-mined the Compustat database. The authors impose MHT as well as 2 restrictions, that the strategies need to work for (1) both 6-factor and Fama-MacBeth regressions and (2) pass a Sharpe ratio test. After these restrictions, the authors find very few strategies that are significant. It is important to remember that the authors’ baseline assumption is that the 6-factors (Fama and French 5-factors plus momentum) are a given. However, the next time someone pitches you a machine learning algorithm, keep this paper in mind. Otherwise, you may be investing in a strategy that sorts on ratios that make no economic sense!
Let us know what you think!
PS: Note I am being a little flippant towards machine learning here, which is not to say it has no value (Google has proven that!). However, I am trying to highlight that machine learning generally comes up with ideas that have been studied in the past, such as Value, Momentum, and Quality to name a few. Machine learning may be able to optimize when to get into and out of a factor (factor-timing), but that has already been shown to be difficult; additionally, one should always consider tax/frictional consequences when investing, and models with more trading should be discounted appropriately for taxable investors.
p-hacking: Evidence from two million trading strategies
- Tarun Chordia, Amit Goyal, and Alessio Saretto
- A version of the paper can be found here.
Abstract:
We implement a data mining approach to generate about 2.1 million trading strategies. This large set of strategies serves as a laboratory to evaluate the seriousness of p-hacking and data snooping in finance. We apply multiple hypothesis testing techniques that account for cross-correlations in signals and returns to produce t-statistic thresholds that control the proportion of false discoveries. We find that the difference in rejections rates produced by single and multiple hypothesis testing is such that most rejections of the null of no outperformance under single hypothesis testing are likely false (i.e., we find a very high rate of type I errors). Combining statistical criteria with economic considerations, we find that a remarkably small number of strategies survive our thorough vetting procedure. Even these surviving strategies have no theoretical underpinnings. Overall, p-hacking is a serious problem and, correcting for it, outperforming trading strategies are rare.
References[+]
| ↑1 | It should be noted that this paper only examines fundamental anomalies. It may be possible that there are more trading signals in the price data, but one needs to assess those signals in the context of other known price anomalies, such as short-term reversion, intermediate-term continuation, and long-term reversion. |
|---|---|
| ↑2 | This 2nd restriction can be somewhat restrictive, but will (if anything) bias the sample towards larger securities. |
| ↑3 | The paper provides more detail on some of the significant trading strategies in the Appendix Tables |
| ↑4 | For those interested in the weeds of the regressions and the tests, I recommend reading section 3 of the paper |
About the Author: Jack Vogel, PhD
—
Important Disclosures
For informational and educational purposes only and should not be construed as specific investment, accounting, legal, or tax advice. Certain information is deemed to be reliable, but its accuracy and completeness cannot be guaranteed. Third party information may become outdated or otherwise superseded without notice. Neither the Securities and Exchange Commission (SEC) nor any other federal or state agency has approved, determined the accuracy, or confirmed the adequacy of this article.
The views and opinions expressed herein are those of the author and do not necessarily reflect the views of Alpha Architect, its affiliates or its employees. Our full disclosures are available here. Definitions of common statistics used in our analysis are available here (towards the bottom).
Join thousands of other readers and subscribe to our blog.