Those in the financial media have recently been writing multiple stories on a fascinating working paper, “Do Stocks Outperform Treasury Bills?” by Hendrik Bessembinder. We originally highlighted the paper on our blog in January. However, recent stories by those at the New York Times (here and here), Bloomberg (here and here), and ETF.com (here) have brought the paper back into the spotlight. We figured it was time for us to chime in on the discussion.
The paper’s title and conclusion are provocative and cause many in the financial industry to pause and take a look.
Here is the abstract of the paper:
Fifty eight percent of CRSP common stocks have lifetime holding period returns less than those on one-month Treasuries. The modal lifetime return is -100%. When stated in terms of lifetime dollar wealth creation, the entire net gain in the U.S. stock market since 1926 is attributable to the best-performing four percent of listed stocks, as the other ninety six percent collectively matched one-month Treasury bills. These results highlight the important role of positive skewness in the cross-sectional distribution of stock returns. The skewness arises both because monthly returns are positively skewed and because compounding returns induces skewness. The results help to explain why active strategies, which tend to be poorly diversified, most often underperform.
The surprising conclusion is that the majority of individual stocks underperform Treasury Bills. An interesting empirical result. The author also finds that portfolios of individual stocks act very differently than their individual constituents.
So what are the pragmatic takeaways for investors?
Some commentators have used these results to argue that passive index investing is the only solution. The logic is that single stock bets only beat Treasury Bills 27 percent of the time in simulations, so why not just own all of them!(1)
We’ll argue that the “buy everything, passively” isn’t necessarily the right (or only) takeaway from the Bessembinder paper. While it is true that passive investing is a great solution for many investors, as it creates a low-cost diversified portfolio, minimizes behavioral errors, and implicitly overweight past winners (through market capitalization weighting), the results from Bessembinder’s paper aren’t an argument for market-cap-weighted passive portfolios. The Bessembinder’s paper key takeaway is that investors should definitely buy diversified portfolios, but doesn’t say much about which individual stock characteristics should be placed in these diversified portfolios. Lawrence Hamtil aptly points this out here, where he highlights that although the Bessembinder results on individual small-cap stocks are scary, when held as a portfolio, investing in small stocks and equal-weighting the portfolio has generated enhanced returns (historically).(2)(3)
So buying any single individual small-cap stock is akin to gambling; however, holding a portfolio of small-cap stocks has actually been a reasonable investment.
Unfortunately, Dr. Bessembinder’s doesn’t go into great detail (save some results on size) on how return distributions shift, after controlling for a variety of individual stock characteristics (e.g., cheap, high momentum, quality, etc.). In other words, is it foolish for investors to focus on our favorite factors — Value, Momentum, and Trend — based on the paper’s results? Clearly, Lawrence highlights that buying portfolios of small-cap stocks might be a reasonable idea, despite that fact that the individual issues within the portfolio have insane return distributions. In this piece, we’ll target “value,” or the cheapness characteristic, and see what the distribution of individual stocks and portfolios of these stocks look like over time.
The Evidence on Generic Value/Growth Portfolios
To give credit where credit is due, the person who started me thinking about the below study is Nir Kaissar.
The recent NYT article has a nice image of the 50 companies that created the most wealth since 1926, as of 9/22/17. Examining the image, Nir asked me about two facts, that at the outset, appear contradictory and troubling, and highlights these in his article which I recommend reading:
- Fact 1: Looking at the 50 companies in the image, there are a lot of Growth stocks.
- Fact 2: Value stocks beat growth stocks.
Nir highlights that the 50 best companies have higher P/E, P/CF, and P/B ratios than the SP500 Value index, and even have a higher P/E and P/B ratios than the SP500 Growth index!
So while Value stocks (on average) beat Growth stocks, why are some of the 50 best investments (as of 9/22/17) Growth stocks? A great question!
In a related study, we examine the distribution of a 30 stock value portfolio and a 30 stock growth portfolio, and come up with the following conclusion–Never buy expensive stocks, period. However, a more accurate description of the conclusion is the following–Never buy a portfolio of expensive stocks, period, for a duration of 50 years!. I think that still holds true today. However, back to our quandary: Value portfolios (cheap) beats Growth portfolios (expensive), yet the majority of the 50 best investments as of today are growth stocks. As Prof. Bessembinder highlights, single stock investing is a lot different than diversified portfolio investing. Let’s dig in a bit…
First, let’s get some baseline data to highlight the “Value beats Growth” argument. Below I show the returns from data using Ken French’s website.
The four returns streams are as follows:
- Ken French Value (FF_VAL): The top 20% (quintile) of firms on the B/M ratio (value-weight portfolio returns)
- Ken French Growth (FF_GROWTH): The bottom 20% (quintile) of firms on the B/M ratio (value-weight portfolio returns)
- Sp500: S&P 500 Total Return
- HML_FF: The HML returns series, again from Ken French’s website
The returns are total returns from 7/1/1975 – 6/30/2015 (matches periods analyzed below), and are gross of any fees or transaction costs.
Detailed table here:
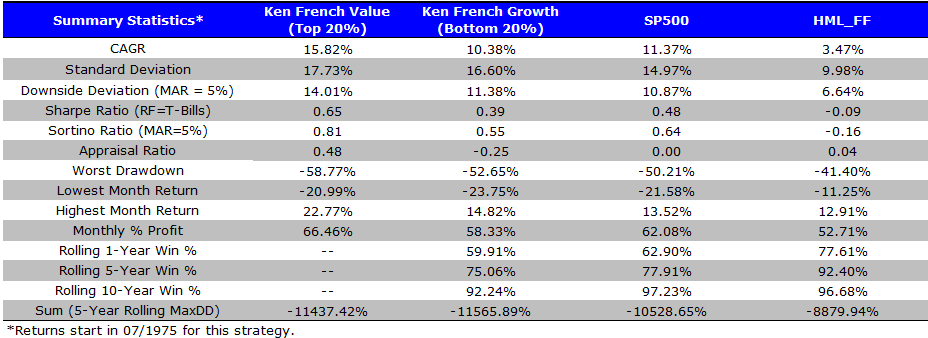
The results are hypothetical results and are NOT an indicator of future results and do NOT represent returns that any investor actually attained. Indexes are unmanaged, do not reflect management or trading fees, and one cannot invest directly in an index.
Over this sample period, the evidence backs the rule of thumb–Value beat Growth over the 40-year period I examined.(4)
We’ve dug into this result in the past and looked at 30-stock portfolio simulations, but these results are associated with portfolios and don’t necessarily examine the distribution of individual stock returns with Value and Growth characteristics. To mirror the Bessembinder study on the distribution of individual stocks, I perform tests below which examine the 5-year and 10-year B&H return to individual Value and Growth stocks.
What Does the Distribution Look Like for Individual Value/Growth Stocks?
The Study: Details and Results
The details of the test are as follows:
- Portfolios are formed on June 30th and do not overlap.(5)
- The 10-year portfolios are formed on 6/30/1975, 6/30/1985, 6/30/1995, and 6/30/2005.
- The 5-year portfolios are similarly formed in ’75, ’80, ’85, ’90, ’95, ’00, ’05, and ’10.
- On 6/30 of the portfolio form date, I split the universe into two Categories:
- Mid/Large Cap Stocks–top 1,500 stocks on market capitalization.
- Small Cap Stocks–all stocks ranked lower than the top 1,500 stocks on market capitalization.
- Within the two size categories, I split firms into Value and Growth:
- Value: The top 20% (quintile) of firms on the B/M ratio
- Growth: The bottom 20% (quintile) of firms on the B/M ratio
- B&H Returns for the stock are calculated from 7/1 for the next 5 or 10 years (ending on 6/30, 5 or 10 years later).
So what are the results?
Below I begin by plotting the 5-year and 10-year B&H returns to the mid/large-cap stocks.
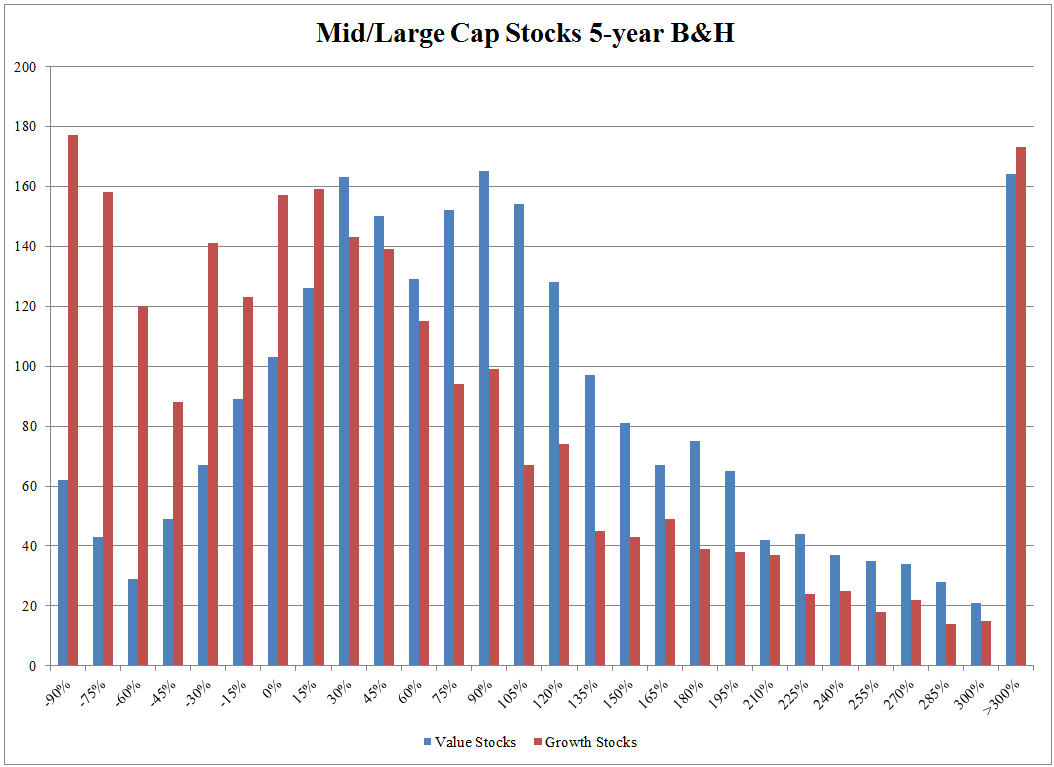
Examining the 5-year B&H individual stock returns, we notice two things:
- There are more negative observations for Growth stocks, while Value stocks have a more pronounced “mediocre” 5-year return between 30%-120% (comparing the two).
- Within the >300% return bucket, the number of Value and Growth stocks are similar, with a slight edge for Growth.
Below I plot the 10-year B&H individual stock returns.
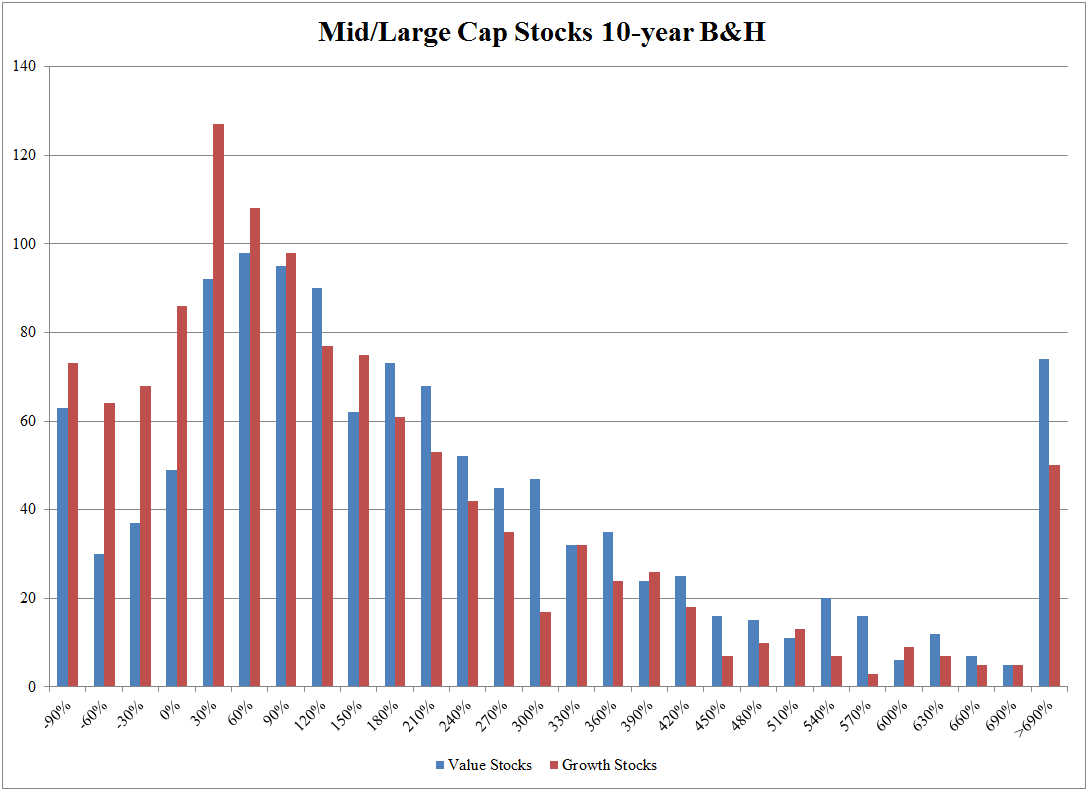
Here we find that over a 10-year period, while the Value and Growth stock distributions get closer, there is still a right “tilt” to the Value stocks. Interestingly, there are also more high-return observations (>690%) for Value firms — not what we would expect!
The Small-Cap Results (Same Analysis as Above, but for Small Firms)
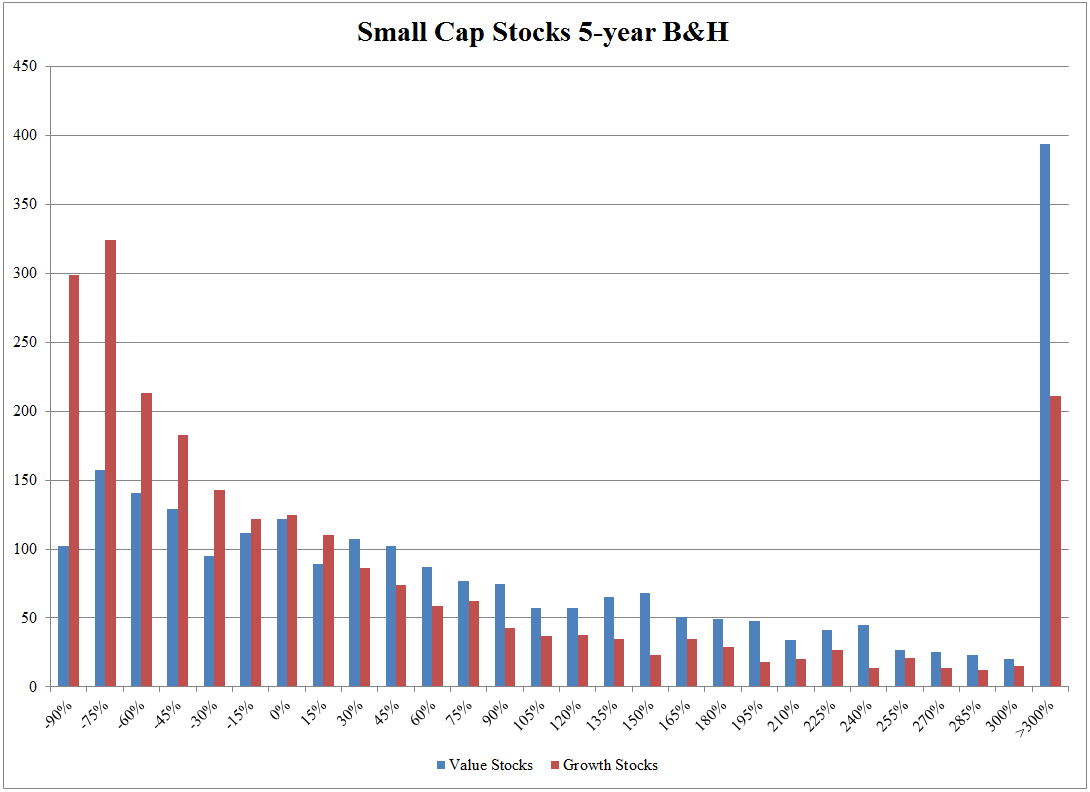
Below I plot the 5-year B&H individual stock returns for small-cap firms.
Below I plot the 10-year B&H individual stock returns for small-cap firms.
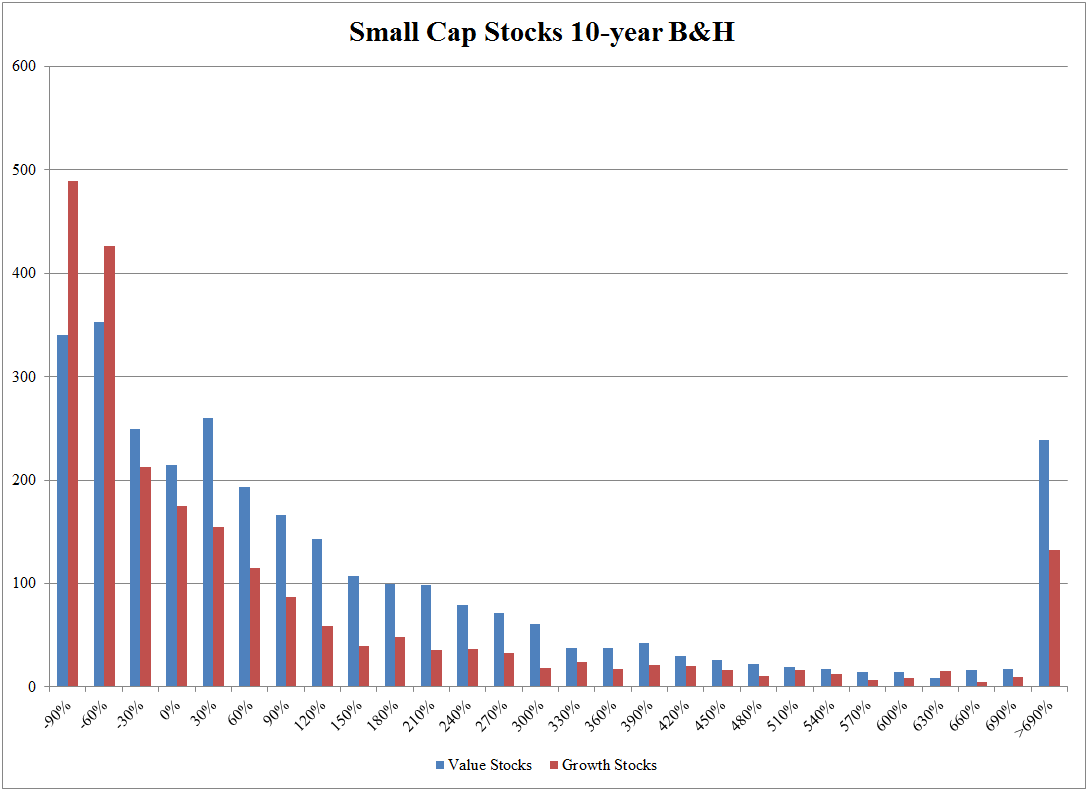
Examining the 5-year and 10-year results, one finds similar (but much more pronounced) results as in the mid/large-cap stocks. At a 5-year level, there are more Growth stock losers (highly negative returns) and at the 10-year return level there are more big winners from the Value stocks.
One thing is clear: avoid expensive small-cap stocks!
Concluding Thoughts
The inspiration for this study is to reconcile two findings: 1) cheap stock portfolios outperform the market (and expensive stock portfolios) and 2) the top individual stocks of all time are all “growth stocks.”
The explanation is as follows–The Bessembinder study examines the total return history of each individual stock, from inception until today, and finds that individual stocks are highly negative skewed — tons of losers, with some big winners. He also highlights that the distribution changes dramatically when one looks at portfolios of stocks.
Bessembinder highlights that individual stocks and portfolios can act very differently. So perhaps it is not that surprising that there are studies that highlight that Value portfolios beat Growth portfolios (not individual stocks), from inception until today. But could it be the case that individual value stocks look terrible? We find that this actually isn’t the case. In the past (examining the data above), cheap stocks actually have better portfolio returns relative to expensive stocks and a better distribution of individual stock returns (on average).
And what’s the point? The point is that there is a lot more to explore and understand from the Bessembinder study.
References[+]
| ↑1 | From the paper: “The single-stock strategy outperformed the one-month Treasury bill over the 1926 to 2016 period in only twenty-seven percent of the simulations.” |
|---|---|
| ↑2 | Equal-weighting a portfolio generally increases the portfolio’s exposure to the Value and Size factors. |
| ↑3 | We discuss both the pros and cons of portfolio diversification here. |
| ↑4 | If one digs back far enough the simple B/M value strategy has a much higher standard deviation! |
| ↑5 | Other start dates yield similar conclusions |
About the Author: Jack Vogel, PhD
—
Important Disclosures
For informational and educational purposes only and should not be construed as specific investment, accounting, legal, or tax advice. Certain information is deemed to be reliable, but its accuracy and completeness cannot be guaranteed. Third party information may become outdated or otherwise superseded without notice. Neither the Securities and Exchange Commission (SEC) nor any other federal or state agency has approved, determined the accuracy, or confirmed the adequacy of this article.
The views and opinions expressed herein are those of the author and do not necessarily reflect the views of Alpha Architect, its affiliates or its employees. Our full disclosures are available here. Definitions of common statistics used in our analysis are available here (towards the bottom).
Join thousands of other readers and subscribe to our blog.