Many investors, investment professionals, and pundits make comments regarding the relationship between stock correlations and opportunities for active stock pickers.
For example, here is a recent example from the Financial Times:
Correlation crash clears way for stockpickers.
The basic (albeit flawed) intuition behind the statement is that when correlations are low, the variation in returns is high, and therefore, stock pickers have an easier time differentiating themselves.
These arguments appear intuitive. So they must be true, right?
Not exactly.
I will show that stocks can be perfectly correlated and have massive return variability, similarly, one can show that stocks can have zero correlation and maintain limited return variability.
How is this possible?
In short, correlation measures examine mean-adjusted returns, not absolute returns.
Back to Basics: How Correlation is Calculated
I have had this discussion many times in person, but never put pen to paper (or fingers to keyboard). However, I recently came across a “correlation & stock-picker’s market” discussion from an investment professional who I deeply respect. Moreover, this investor is well-known for pursuing an evidence-based investment philosophy. So I figured it was time to write an article explaining why these types of claims are flawed.
Let’s make use of my Ph.D. in mathematical finance and delve into a formula. I realize formulas are not everyone’s cup of tea, so I try to translate my argument into plain English. I even built a spreadsheet you can download. The spreadsheet shows how the numbers trickle through and contradict the notion of any relationship between correlation levels and opportunities for active stock pickers. Just in case mathematical formulas are too confusing or not compelling enough, I also provide a separate and intuitive way to reason around these misguided assertions.
Figure 1: Correlation Formula
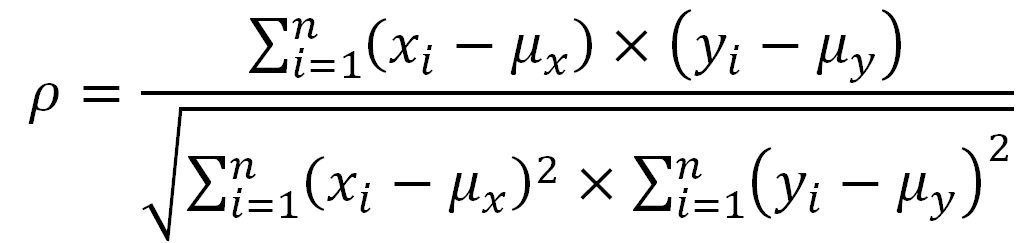
Source: Aaron Brask Capital
The Correlation Formula
The first and most obvious (for mathematically inclined folks) way to illustrate the lack of relationship between correlations and opportunities for picking stocks is to examine the correlation formula directly (see Figure 1). Notice that the mean returns of the assets are subtracted from each of the data points. So no matter what the mean returns are, the correlation formula only looks at deviations from the mean. In other words, the correlation formula effectively ignores the mean returns of the assets. However, this is precisely what active managers picking stocks are targeting, not just the relative performance, but the absolute performance of an asset. If mean returns are very different across stocks, the correlation formula is basically useless for indicating opportunities for stock pickers.
One might ask why the correlation formula subtracts out the means. To be clear, this is not a flaw in the formula itself; it is more an issue of how the formula is applied. When data is sampled from a larger population and analyzed (think of the heights of human beings), the population mean is the best guess for any individual observation (when randomly chosen). Moreover, the average of any sizeable sample of data points should be close to the population mean. So it is sensible to assume the mean of the sample is relevant.(1)
However, the returns of financial assets are not independent random samplings from an existing population of returns. Stocks follow fundamentals over the long term. All else equal, returns in one period impact the distribution (e.g., mean) of returns going forward. This is especially true over the long-haul, where there is a striking correlation between valuation and future expected returns. See the chart below from Meb Faber’s paper on the subject of valuations and future returns.

In other words, the returns are not independent. For example, consider an asset that was expected to return +10% over the next year. If it jumped 10% on the first day, then the expected return would no longer be 10% but something closer to zero.(2)
My point with the above example is that subtracting a mean return from observed returns does not make perfect sense with asset returns since there is time-series dependence (the mean would change through time). In practice, this may or may not have a significant impact on the correlation calculation and this might just be nitpicking. However, it does not alter the primary point of the article; correlations are more or less useless when one is ultimately concerned with overall asset performance.
A Spreadsheet Illustration
Looking at and discussing formulas might give some folks a headache. So I built a spreadsheet to illustrate that assets can be 100% correlated but have significantly different returns. In particular, I used randomly generated numbers to simulate two stock trajectories. The simulation was designed so that the stocks were perfectly (100%) correlated. However, I created inputs for the expected returns and volatility for the stocks.
The spreadsheet contains four sections (three of which are depicted in Figure 2 below). The first section is for the inputs. You can enter expected returns for two stocks labeled A and B. You can also enter a figure for the expected volatility. If you hit F9, then the second section containing a table of simulated data (not shown here) will update.
In the third section for output you will see two figures. The first is the correlation of the two stocks. This will always be 100% by design. The second output figure will be the difference in the returns. This return spread will show the assets perform according to the expected returns (albeit with some random noise).
The fourth and last section is a chart of the stock trajectories. As you will see, the stocks will move in the same direction on a daily basis, but eventually, follow the paths as dictated by their expected returns. This illustrates my overall point; stocks can have a 100% correlation but generate completely different returns.
Figure 2: Spreadsheet snapshots
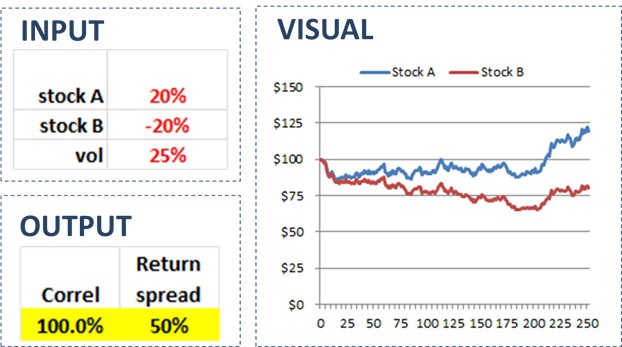
Source: Aaron Brask Capital
One More Intuitive Perspective
I hope the above discussion and my spreadsheet have shown the correlation formula can be altogether useless when measuring the opportunity for stock-picking opportunities. However, I will offer one last perspective that will hopefully put a nail in the coffin of the misguided claims around this notion.
Let us consider the hypothetical scenario where stocks moved 100% in lockstep. That is, every stock price is 100% correlated, but also has the same volatility and mean return. Interestingly, this perfect correlation would actually create opportunities for active managers because the fundamental performance of stocks varies. In particular, lockstep price movements would pull some prices away from their fundamentals and thus create mispricing opportunities for active managers to exploit.(3)
So the next time someone writes an article or tells you a story that, “This is a stock pickers market because correlations are so low,” or, “this is a rigged market driven by passive, with no chance for active management — correlations are simply too high,” respectably tell them that they may be wrong.

References[+]
| ↑1 | Subtracting the mean within the correlation formula creates symmetry that results in some mathematically elegant properties. In particular, the calculation always falls between -1 and +1 and results of -1, 0, and +1 have specific interpretations. This makes correlation results very intuitive. |
|---|---|
| ↑2 | This assumes fundamentals have not changed. In the case of a 20% return, that may be unlikely (something might have changed). However, this is for illustrative purposes only and the same logic applies to smaller returns. The bottom line is that the expected return estimate should be updated after each observation. Admittedly, this is a subtle but interesting topic. However, it is not necessary to support the primary point of this article. |
| ↑3 | Interestingly, I would argue there are currently many rules-based strategies being employed that are impacting stock price trends including correlations. I discuss these strategies and their potential impact going forward in my Zombie Market Primer article. |
About the Author: Aaron Brask
—
Important Disclosures
For informational and educational purposes only and should not be construed as specific investment, accounting, legal, or tax advice. Certain information is deemed to be reliable, but its accuracy and completeness cannot be guaranteed. Third party information may become outdated or otherwise superseded without notice. Neither the Securities and Exchange Commission (SEC) nor any other federal or state agency has approved, determined the accuracy, or confirmed the adequacy of this article.
The views and opinions expressed herein are those of the author and do not necessarily reflect the views of Alpha Architect, its affiliates or its employees. Our full disclosures are available here. Definitions of common statistics used in our analysis are available here (towards the bottom).
Join thousands of other readers and subscribe to our blog.