When it comes to trend following and/or time-series momentum research, we got ya covered!
A few places to dig in:
- Evidence for Long-Term Trend-Following by Alpha Architect
- World’s Longest Trend-Following backtest by Alpha Architect
- Diversification Benefits of Time Series Momentum by Larry Swedroe
- 8-Part Trend-Following Course by Valeriy Zakamulin
As a general theme, the articles above highlight the benefits of trend-following or “time-series momentum” strategies.(1)
In addition to the articles above, there are multiple pieces from other authors (Meb Faber, Corey Hoffstein, Gary Antonacci, Invest Resolve crew, Ritholtz crew, AQR crew, and so forth), all saying roughly the same general thing — “Trend Following works.”
Great, trend-following seems to be a pretty robust phenomenon found across multiple markets, asset classes, and research groups…
Let’s Attempt to Avoid Confirmation Bias
Confirmation bias, or the desire to seek conforming opinions, is a debilitating behavioral bias that can lead to overconfidence and blind spots in investing. We try and avoid this problem, but without a deliberate effort to avoid the bias, we will fail. Trend-following is a great case study. Almost everything we read and write about confirms what we already understood. Having Valeriy Zakamulin post our trend-following series (a known trend-following expert/skeptic) was our first move in the right direction. We also highlighted a piece on time-series momentum (and our follow-on investigation), which suggested that time-series momentum results are entirely driven by volatility weighting.
And now we have another challenge to Time-Series Momentum from Professors Huang, Li, Wang, and Zhou (Guofu Zhou is one of our favorite researchers at Alpha Architect!). The title of their paper is, “Time-Series Momentum: is it There?”
Here is the punchline from the provocative paper:
Overall, the evidence on TSM is quite weak, especially for the large cross section of assets.
and here is an additional comment that clarifies their findings:
…our paper does not claim that there is no predictability in the asset classes, but that our results simply show that the predictability, if it exists, is not as simple as a constant 12-month return rule…
Does Trend-Following/Time-Series Momentum Even Work?
The authors discuss a variety of past research papers on time-series momentum but pay particular attention to the Moskowitz, Ooi, and Pedersen (“MOP”) 2012 JFE paper, “Time Series Momentum.” This paper is arguably the first paper in recent memory to crack the top-tier academic journals with a paper on trend-following, often considered by the current ivory tower establishment to be a shoddy attempt to challenge a basic tenant of the efficient market hypothesis, which states that prices always reflect fundamentals.
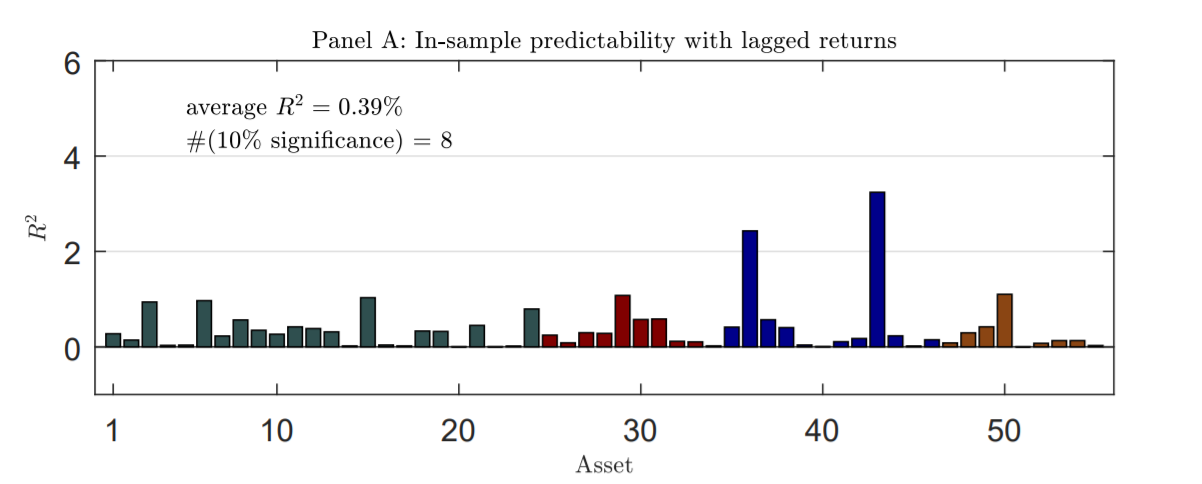
The data used in the study is similar to that used in MOP and includes 55 instruments from 1985 to 2015. All results reported (unless noted) are excess returns (i.e., collateral returns aren’t included).
The first analysis revolves around so-called predictive regressions, a concept we have discussed in the past (an excel spreadsheet is included), and arguably a crude form of “machine-learning.” The technique is as follows — run a regression of next month’s returns on a given asset (Y-variable) against the asset’s past 12 month returns (x-variable) and see if the beta coefficient is reliably different from zero: If beta<>0, the 12-month returns are assumed to be predictive, otherwise, they are assumed to be noise.
Simple enough.
But there is a problem, the evidence for time-series momentum as a predictor of future 1-month ahead returns is not compelling (although, I’m not sure anything can reliably predict month-ahead asset returns).
For example, the figure below highlights the R^2 across all test assets:
The authors also look at the out-of-sample predictability of time-series momentum, which is essentially looking at how well the predictive regression does relative to simply predicting future returns based on the average of the past returns. Turns out the evidence is pretty weak — time-series momentum doesn’t do a great job predicting future returns.
Next, the authors explore more sophisticated approaches to time-series momentum prediction and include the possibility of information across assets. Instead of using the data on past returns for a given asset, the techniques allow the authors to use the past returns on a given asset — and other assets — to help predict future 1-month returns.
Again, no dice when it comes to out-of-sample predictability relative to simply using the past historical returns as a predictor of future returns.
From the paper:
When turning to out-of-sample forecasting, however, the PLS method does not help much. All the R^2_os (out of sample) are generally negative, with seldom exceptions. For example, in the case of forecasting the next one month return with the past 12-month return, there are only nine assets displaying significantly positive R^2_os (out of sample) at the 10% level or stronger
D’oh!
So how did the MOP get their results published? Well, they weren’t using the statistical techniques outlined above. The authors relied on pooled regressions and also scaled each asset by volatility.
Here are the replicated results of the pooled regression technique, from the Huang, Li, Wang, and Zhou paper under discussion:
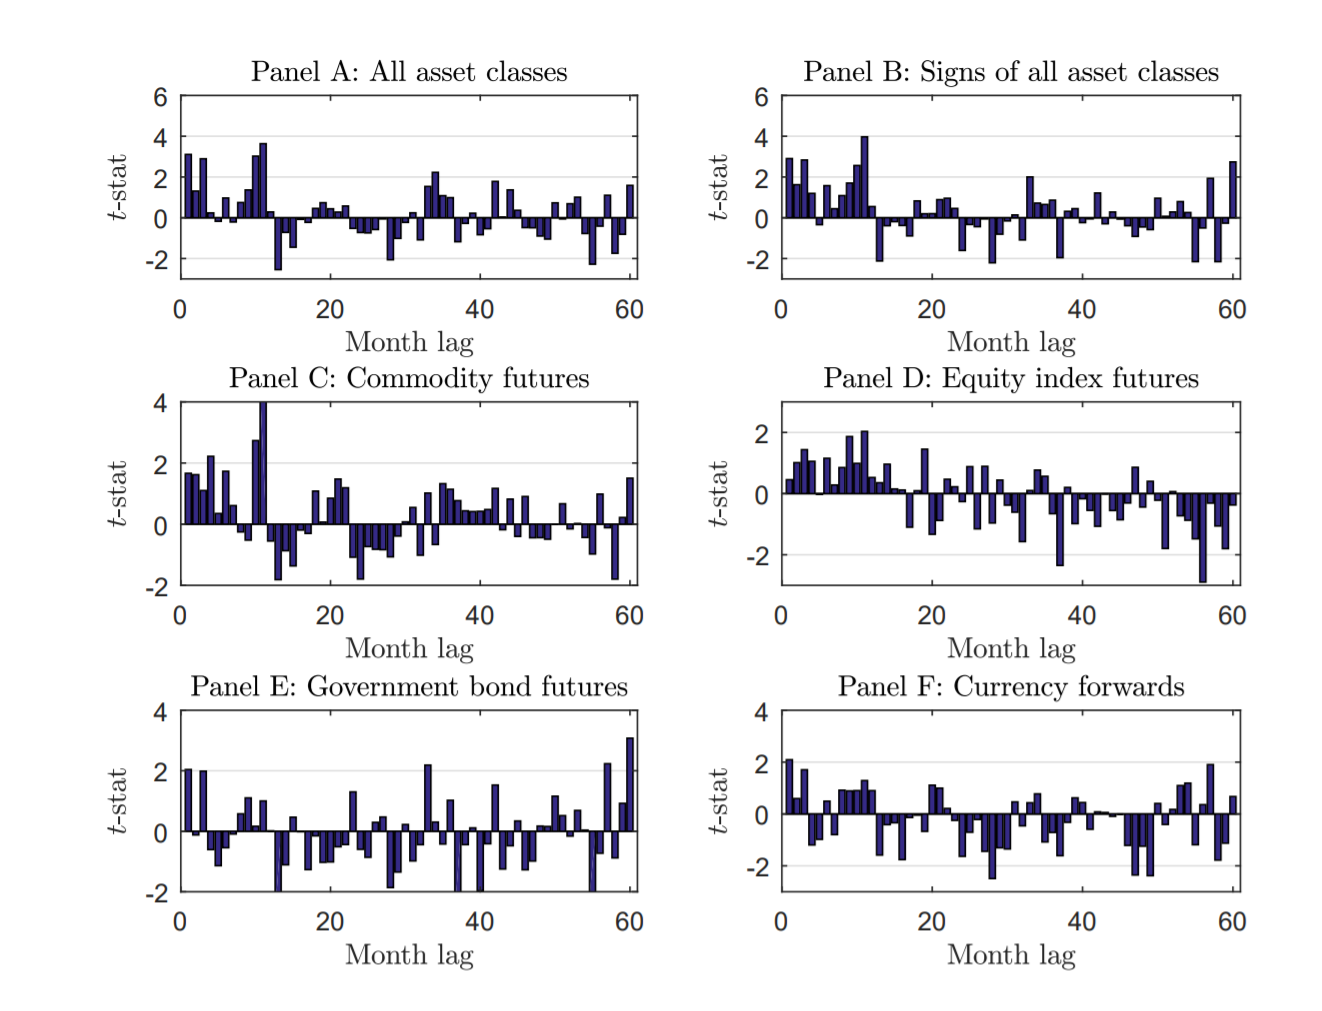
The results all look pretty good — a longer-term trend (~12 months) predicts monthly returns.
These charts also look similar to those from the original MOP paper. A link to the original paper is found here. The first set of charts below (Panel A and Panel B) are equivalent to Panel A and B from the image above.
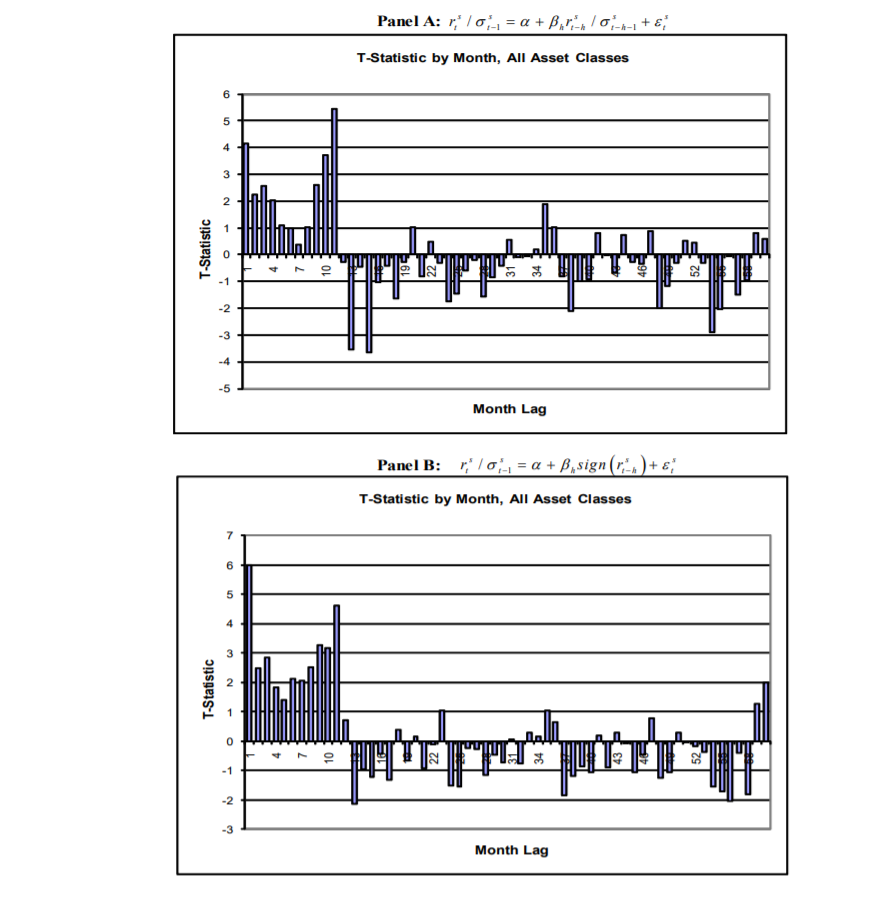
The next set of charts from MOP are equivalent to the asset class charts C, D, E, and F from the figure above from the paper under discussion:
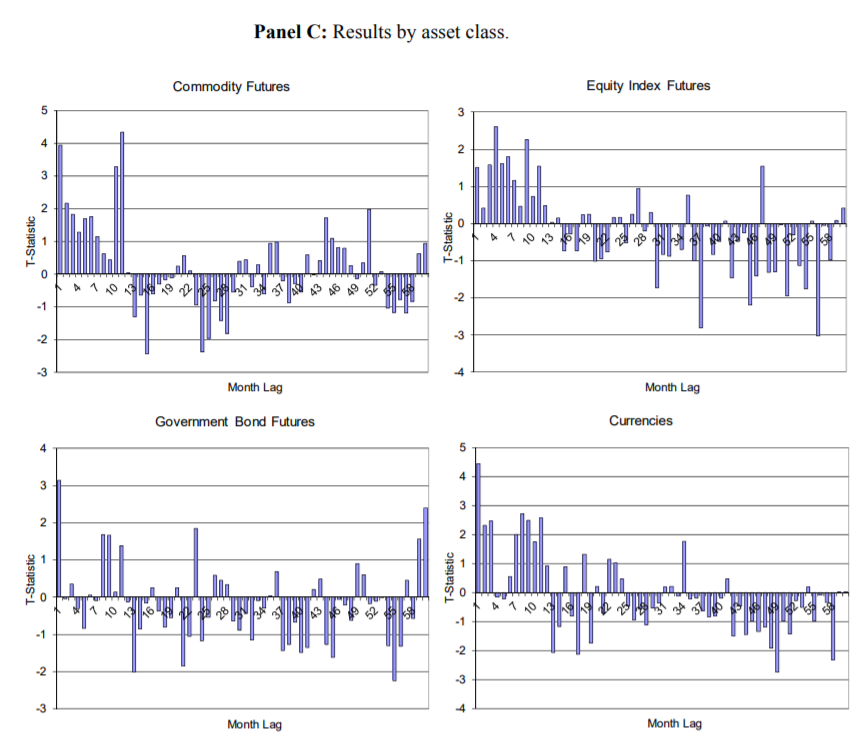
The replication results are basically good to go and pooled regression results seem to suggest that time-series momentum is fairly robust.
Long story short, it turns out the pooled regression technique could put an upward bias on the regression coefficients if one fails to control for individual asset mean returns in the analysis. There is also an esoteric argument from this paper that there is a potential look-ahead bias in the analysis.
A detailed description from the authors:
…when assets have different average returns, the pooled predictive regression with controlling for fixed effect suffers from a looking-forward bias because the time-series demeaning of the data requires information after month t, which induces a correlation between the lagged value of the demeaned regressor and the error term in the predictive regression.
To solve these potential econometric problems the authors suggest the use of bootstrapping. This approach allows one to move from a theoretical world to a simulation world. Simulations are cheap and easy and can facilitate a different look at the results. Using this approach, the authors identify the critical t-values required to identify a result that is reliably different from zero. In general, the bootstrapped t-stats are much higher than the t-stats associated with the results from the MOP paper or from the replication effort in this paper (the paired bootstrap are roughly in line with the standard t-stats). For example, the t-stat for predicting the 1-month ahead return with the past 12-months of data has a 4.48 t-statistic. However, the 95% cutoff using the bootstrapped t-stat is 4.96, which is higher than 4.48, and thus suggests that time-series momentum may not be a reliable predictor of future 1-month returns — at least from a statistical perspective.
The overall conclusion from the analysis in this paper is that the statistical evidence for time-series momentum’s ability to predict 1-month ahead returns is marginal, at best.(2)
In the author’s words:
With the same data as MOP but extending to 2015, we show that, statistically, the evidence of TSM is weak with time-series regression and the pooled regression over-state the predictive ability of the past 12-month return. Economically, we show that the performance of the TSM 21 strategy is mainly driven by differences in mean returns.
Conclusions
If one is trying to predict 1-month ahead average returns with 12-month time-series momentum they’ll be hard-pressed to find definitive statistical proof that it works. However, we would add that because 1-month ahead average returns are extremely noisy, it would be difficult to ascertain statistical significance, even if a specific predictor had true predictive power. Time-series momentum-based strategies, like all other predictive signals, can’t reliably help one generate higher expected average returns.
To be clear, this paper doesn’t suggest that trend-following is dead and/or doesn’t exist (On the contrary, one of the authors on this paper (Guofu Zhou) has another co-authored paper (with Yufeng Han and Yingzi Zhu) on “trend-factor,” which shows that more sophisticated trend following can have strong and stable profits in equilibrium, but the profit potential is dynamic and depends on the proportion of trend-followers in the marketplace. Simply put, the big takeaway from this paper is not that trend-following results are “fake news,” rather, the MOPs analysis of a simple trend-following/time-series momentum strategy are possibly overstated and their claims are arguably too strong. This statement is based on more advanced statistical techniques and approaches that possibly correct for biases in the original tests.
(3)The biggest blind spot in the paper, or perhaps where we would have liked to see additional commentary, is related to the diversification benefits of trend-following strategies. Trend/Time series strategies are often used in the context of investment management to curb tail risk and reshape the distribution of returns, not increase the average return, per se. We discuss this in detail in an older post of ours on the subject. It would be interesting if the authors expanded their analysis and discussed how the unique diversification benefits of trend-following strategies may or may not be affected by the choice of empirical methodology.
Let us know what you think!
Time-Series Momentum: Is it There?
- Huang, Li, Wang, and Zhou
- A version of the paper can be found here.
Abstract:
Time-series momentum (TSM), which refers to the predictability of the past 12-month return on the next one-month return, is the focus of quite a few recent influential studies. This paper shows, however, that asset by asset time-series regressions reveal little TSM both in- and out-of-sample. In a pooled regression, the usually used t-statistic can over-reject the no predictability hypothesis, and three versions of bootstrap corrected t-statistics show that there is no TSM. From an investment perspective, although the TSM strategy is known to be profitable, it performs the same as a similar strategy based on historical mean that does not require predictability. Overall, the evidence on TSM is quite weak, especially for the large cross section of assets.

References[+]
| ↑1 | Throughout the article we will use trend-following and time-series momentum, interchangeably. |
|---|---|
| ↑2 | That said, it should be pointed out this takeaway is dependent on which statistical approach one prefers. For example, the results in Table 3 and 4 using the Pair Bootstrapped approach are roughly similar to the originally devised results. The big differences in interpreting statistical significance are related to the Wild and Fixed-design Bootstrapping techniques. |
| ↑3 | Here is a study we did that uses various approaches to assessing the benefits of Trend-Following. Our conclusion is that one only finds results if one uses actual data that preserves the time series properties of reality. |
About the Author: Wesley Gray, PhD
—
Important Disclosures
For informational and educational purposes only and should not be construed as specific investment, accounting, legal, or tax advice. Certain information is deemed to be reliable, but its accuracy and completeness cannot be guaranteed. Third party information may become outdated or otherwise superseded without notice. Neither the Securities and Exchange Commission (SEC) nor any other federal or state agency has approved, determined the accuracy, or confirmed the adequacy of this article.
The views and opinions expressed herein are those of the author and do not necessarily reflect the views of Alpha Architect, its affiliates or its employees. Our full disclosures are available here. Definitions of common statistics used in our analysis are available here (towards the bottom).
Join thousands of other readers and subscribe to our blog.