Not long ago I used to teach investment management courses to Master’s students (MBAs and MS Finance types).
A core aspect of my course was so-called modern portfolio theory. We did a lot of math and problem-sets to make it feel like we were doing something useful.
But I can summarize the core muscle movements of portfolio theory in 3 slides.
Slide 1: The Math Works.
Why do academics love diversification? Well, they love the math. Let’s explain…
Let’s say you walk up to someone on the street and say the following:
“Hey, I have 1000 assets for you: Each assets has a 10% expected return, but these assets are insanely volatile. Also, all these bets are structurally uncorrelated with anything in the world.”
That sounds OK in theory, but do who wants to own a bunch of incredible risky assets? Nobody!
But wait, what if someone with a PhD told you that this offering has no risk and is essentially a guaranteed 10% return!
Say what? How can a bunch of “insanely volatile” assets create a guaranteed 10% return?
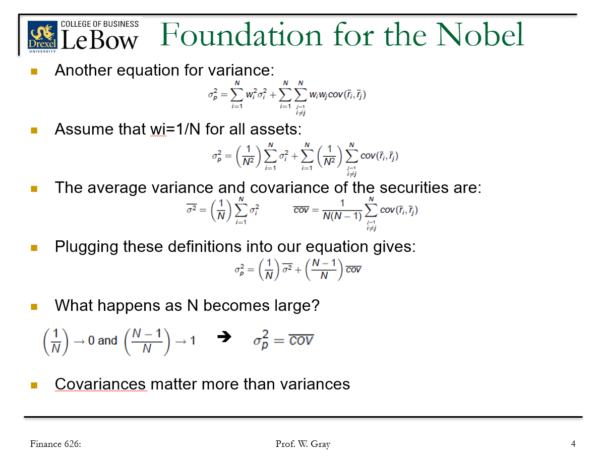
Well, math can help explain how this works. An old course slide…

Source: Wes old course slide
Pooling uncorrelated bets lead to no risk as the number of bets goes to infinity.
Magic!
Many of us in finance now generally understand this concept (even if we don’t know the math). Of course, some smart people have gotten in trouble for relying on this concept. But before we get to the “why” on how blindly following the diversification math can get you in trouble, we’ll attempt to make the concept even clearer via a picture.
Slide 2: Diversification Works…
Let’s “prove” the math with a picture.
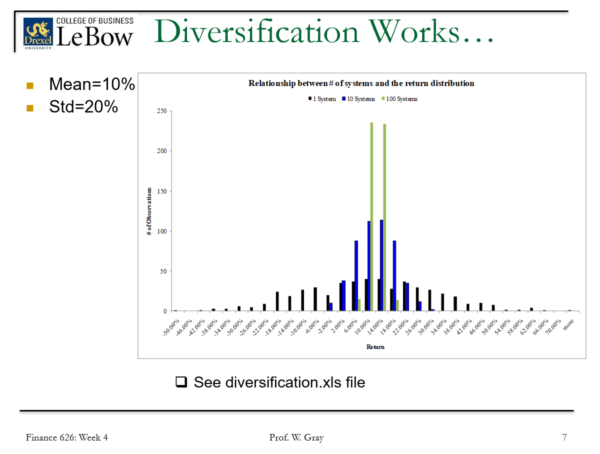
We’ll have our spreadsheet conducts a 1000 simulations. In each simulation run, a portfolio system can do the following:
- Take 1 bet
- Take 10 bets
- Take 100 bets
Some bet parameters:
- All bets are uncorrelated.(1)
- Each bet has a 10% mean and a 20% standard deviation (roughly equivalent to owning the S&P 500 stock market bet).
We then plot the distribution of outcomes for these 1,000 simulations to highlight the possible return outcomes for the 3 different portfolio systems.
In the chart below, black represents the outcome distribution for a 1,000 simulations where the portfolio holds 1 bet, blue reflects the 10 bet system, and green reflects the 100 bet system.

Source: Wes old course slide
As the math above suggests, one can eliminate risk by pooling uncorrelated bets together. The single bet portfolio has a huge distribution, whereas the 100 bet system (green) is almost centered perfectly around 10%. If we had a 10,000 bet system you’d start to see a large spike around the 10% mark. Long story short, more uncorrelated 10% bets mean less volatility, but the same 10% expected return.
Slide 3: Diversification Works…Until it Doesn’t
The math is beautiful, but there are a lot of embedded assumptions in portfolio theory. Specifically the assumption that correlations are not regime-dependent. (See Elisabetta’s piece on the topic)
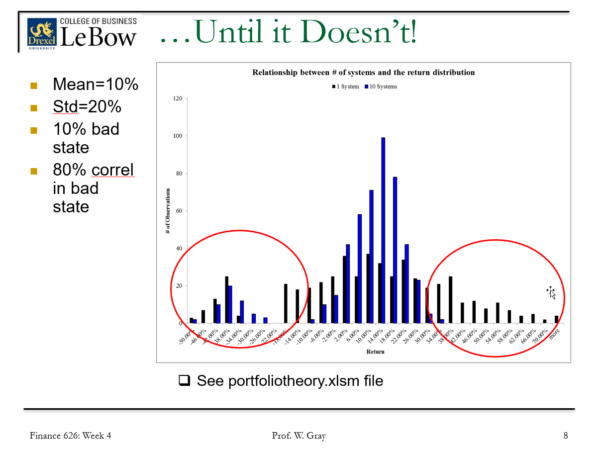
But what happens if we change the simulation design from above and include a 10% possibility of a “bad state of the world” where correlations go from 0 across all bets to 80%. Think about almost every major meltdown the world has witnessed.
Well, in this world, many of the so-called benefits of diversification go out the window…Note the extreme right tail outcome distribution is just as big for a single bet portfolio or a 30 bet portfolio.
Relying on diversification without considering the possibility of correlated fat left tails is a sneaky situation. Diversification, which is supposed to help an investor, ends up hurting the investor by “diversifying” away all their upside potential while leaving them with a steaming pile of downside risk when the world blows up. Yuck!
Bottom Line?
The world is not a simple bell curve. The world cannot be modeled via expected returns and covariance matrices. The world is too dynamic, driven by sentiment, and fraught with integrated funding sources (i.e., leverage channels). The only thing we can say is things that have never happened seem to happen all the time.
Diversification, like all concepts in investing, is simple, but not easy. Thinking is still required.
About the Author: Wesley Gray, PhD
—
Important Disclosures
For informational and educational purposes only and should not be construed as specific investment, accounting, legal, or tax advice. Certain information is deemed to be reliable, but its accuracy and completeness cannot be guaranteed. Third party information may become outdated or otherwise superseded without notice. Neither the Securities and Exchange Commission (SEC) nor any other federal or state agency has approved, determined the accuracy, or confirmed the adequacy of this article.
The views and opinions expressed herein are those of the author and do not necessarily reflect the views of Alpha Architect, its affiliates or its employees. Our full disclosures are available here. Definitions of common statistics used in our analysis are available here (towards the bottom).
Join thousands of other readers and subscribe to our blog.


