We built a simple tool recently to review so-called value spreads over time. (1)
This tool maps out the median valuations for the top decile and bottom decile “cheap stock” portfolios (e.g. EBIT/TEV or sales/price).
Why might this be useful?
This tool allows one to identify the “valuation” spread between the cheapest stocks and the most expensive stocks in the universe. Some research suggests this can be a useful prediction device.
The analysis to build the data works as follows:
- Identify Universe: Top 1500 stocks by market cap (US and EAFE)
- Identify Valuation: Calculate a valuation metric (e.g., EBIT/TEV) for all firms in the universe
- Decile Splits: Sort the 1500 stocks into 10 buckets, 150 stocks each, equal-weight, rebalance monthly
- Calculate Median Valuation: For each decile, calculate the median valuation metric (e.g., EBIT/TEV)
- Plot the data
We create the following time series (assuming EBIT/TEV is the value metric):
- US Value = Top Decile EBIT/TEV (1)
- US Glamour = Bottom Decile EBIT/TEV (10)
- US Spread = US Value – US Glamour
- EAFE Value = Top Decile EBIT/TEV (1)
- EAFE Glamour = Bottom Decile EBIT/TEV (10)
- EAFE Spread = US Value – US Glamour
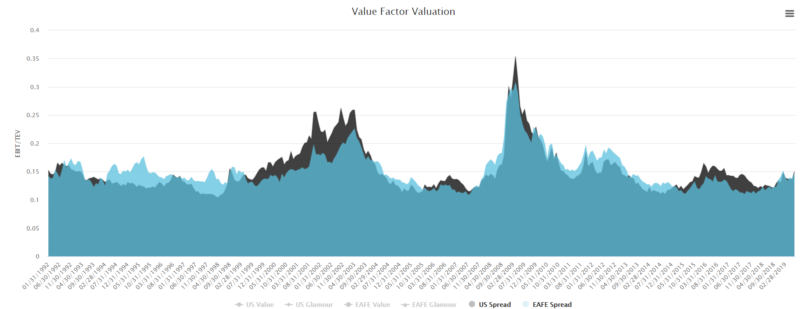
Here is a chart of the spreads since 1992 for the US and EAFE. You can dig in to the tool for the raw data and additional breakouts on the data.
Conclusions
Spreads aren’t crazy and fairly in line with historical norms. Surprising.

About the Author: Wesley Gray, PhD
—
Important Disclosures
For informational and educational purposes only and should not be construed as specific investment, accounting, legal, or tax advice. Certain information is deemed to be reliable, but its accuracy and completeness cannot be guaranteed. Third party information may become outdated or otherwise superseded without notice. Neither the Securities and Exchange Commission (SEC) nor any other federal or state agency has approved, determined the accuracy, or confirmed the adequacy of this article.
The views and opinions expressed herein are those of the author and do not necessarily reflect the views of Alpha Architect, its affiliates or its employees. Our full disclosures are available here. Definitions of common statistics used in our analysis are available here (towards the bottom).
Join thousands of other readers and subscribe to our blog.