As many investors have experienced, Value investing has underperformed for some time now. For the period following the Global Financial Crisis, Value investing (in general) has underperformed (1) the market and (2) Growth stocks.
So while the past decade has been rough for Value investors, it can be a good time to examine the process and importantly determine how one forms their Value portfolio, with the hope that the next decade will be better for Value stocks.
Two quick questions that come to mind:
- How many Value stocks should I hold? In other words, does more concentration to the Value factor make sense?
- How much variation is there amongst the different “Value” metrics?
Below, I hope to answer those questions by examining both U.S. and Developed markets.(1)
Overview of the Data
All of the analysis below is done using data from FactSet. The time period covered is from 1/1/1989-6/30/2019 for the U.S. universe and from 1/1/1994-6/30/2019 for developed markets.(2)
Each month, the universe is the top 1,000 firms based on market capitalization within either the U.S. or developed markets (two separate universes), given that the firm has information for each of the following variables:
- EBIT / Total Enterprise Value
- Free Cash Flow / Total Enterprise Value
- E / P (Earnings / Market Capitalization)
- B / M (Book to Market)
The portfolios are formed every month and overlapping portfolios are used (more explanation below). Below are the returns and correlations between the U.S. universe and the Russell 1000 Index (1/1/1989-6/30/2019). Returns are gross of any management fees or transaction costs.
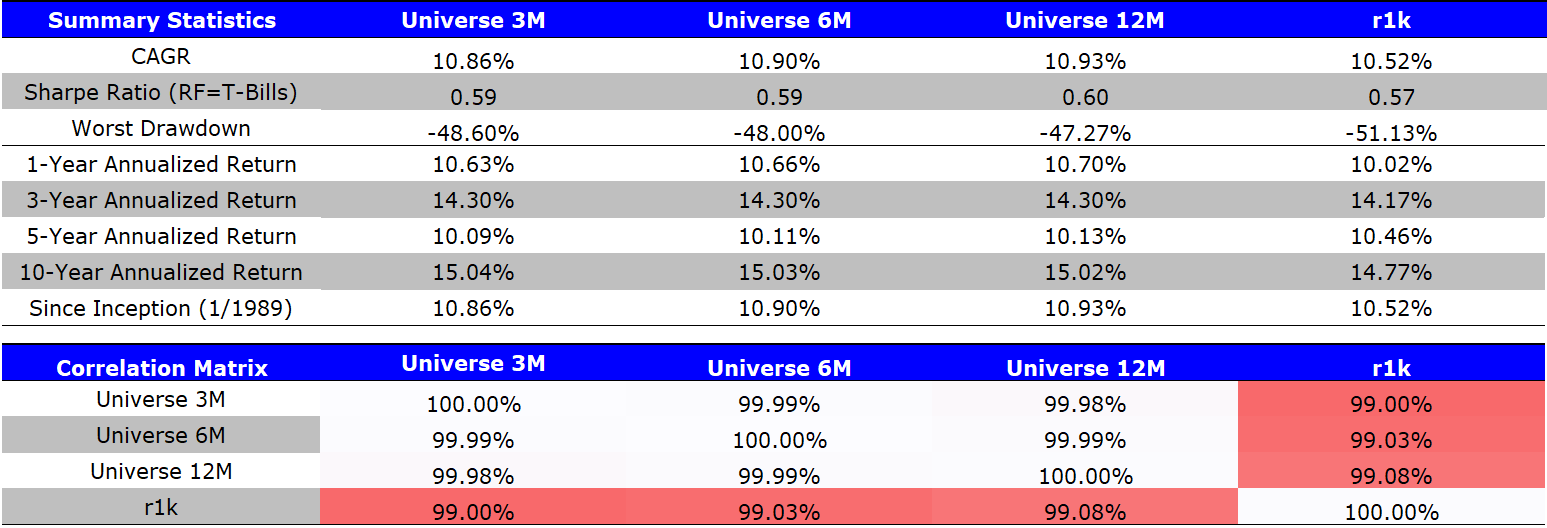
The results are hypothetical results and are NOT an indicator of future results and do NOT represent returns that any investor actually attained. Indexes are unmanaged, do not reflect management or trading fees, and one cannot invest directly in an index. Additional information regarding the construction of these results is available upon request. Source Data: FactSet
Due to the lack of data availability for the EBIT/TEV measure for most financial companies, the universe generally excludes financial stocks.(3) While this has an impact, as is shown above, the correlation between the Universe return to a well-known benchmark (Russell 1000) is over 99%.
As you can see above, I have 3 Universe returns.
Why?
In the section below, I plan to vary the holding period to be either 3 months, 6 months, or 12 months while using overlapping portfolios. So above, the “Universe 3M” represents 3 overlapping Universe portfolios. For example, portfolios would be formed on the close of 1/31/19, 2/28/19, and 3/31/19 (assumed to be rebalanced at the close). The return for April 2019 would be the average of the returns of the 1/31, 2/28, and 3/31 rebalance dates.
Similarly, the 6M and 12M represent 6 and 12 overlapping portfolios. Overlapping portfolios can be used to minimize the impact of rebalancing/timing luck. This portfolio structure is also common in academic research analysis.(4)
Below is a similar analysis for developed international markets. The universe returns are here compared to the MSCI EAFE index. Returns run from 1/1/1994-6/30/2019 and are gross of any management fees or transaction costs.
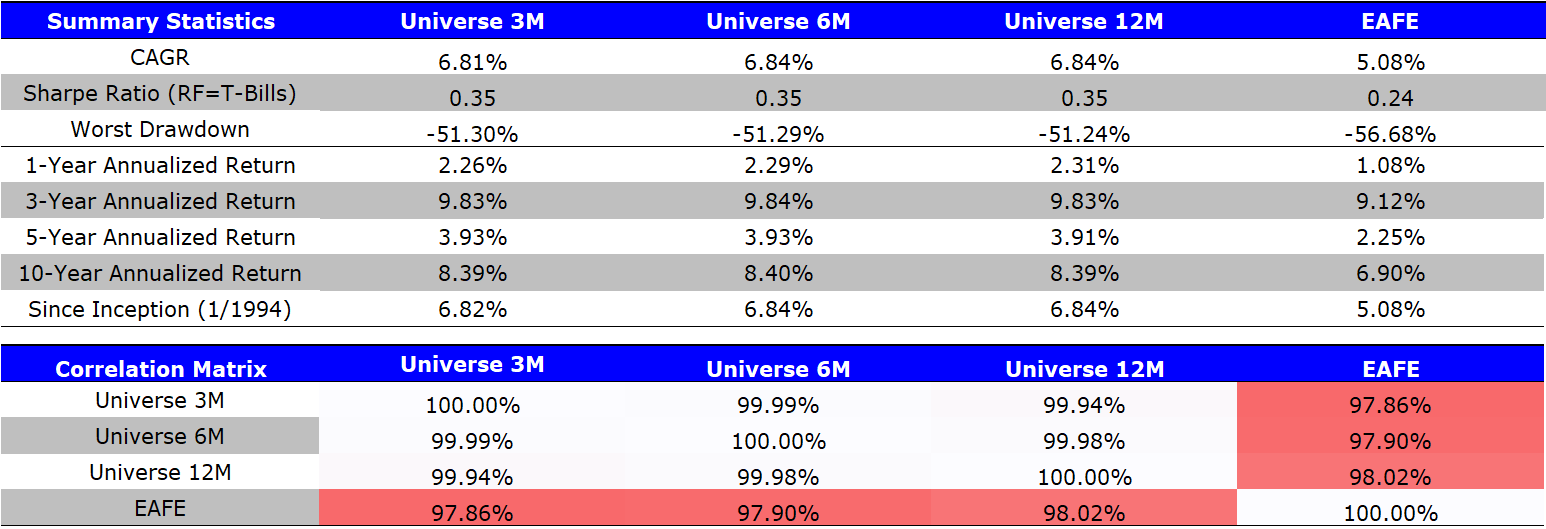
The results are hypothetical results and are NOT an indicator of future results and do NOT represent returns that any investor actually attained. Indexes are unmanaged, do not reflect management or trading fees, and one cannot invest directly in an index. Additional information regarding the construction of these results is available upon request. Source Data: FactSet
As one can see above, the correlation is high (near 98%), while the returns are not exactly the same.(5) Thus, we have seen that the universes are fairly similar to the respective indices.
Next, we examine very simple quintile splits of the data on each of the Value measures.
Value/Growth Quintiles
Below, we examine the returns over the full-time period, as well as the past 10 years, by splitting the data using 4 Value measures:
- EBIT / Total Enterprise Value
- Free Cash Flow / Total Enterprise Value
- E / P (Earnings / Market Capitalization)
- Average Ranking (of the three measures above)
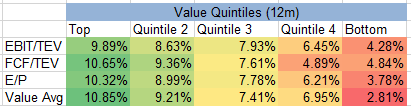
For ease of exposition, I will stick with the 12-month rebalance portfolios (using 12 overlapping portfolios) to simply examine the performance of Value and Growth stocks when the universe is split into quintiles. The results are similar (directionally) using both the 3-month and 6-month portfolios.
Below are the results to the U.S. Universe over the full sample. Returns run from 1/1/1989-6/30/2019 and are gross of any management fees or transaction costs.
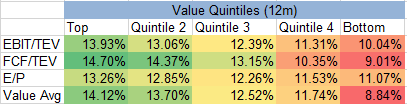
The results are hypothetical results and are NOT an indicator of future results and do NOT represent returns that any investor actually attained. Indexes are unmanaged, do not reflect management or trading fees, and one cannot invest directly in an index. Additional information regarding the construction of these results is available upon request. Source Data: FactSet
As can be seen above, over the long-run, Value beat Growth investing. The Universe CAGR over this time period was 10.93% while the R1K CAGR was 10.52%. It should be noted that the Value/Growth quintiles are formed by equal-weighting the portfolio, while the Universe and R1K are market-cap weighted portfolios.
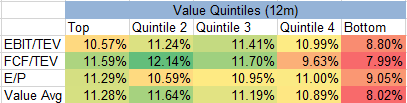
However, as many have experienced, this is not always the case. The results below are from 1/1/2009-6/30/2019.
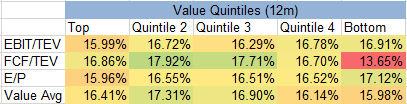
The results are hypothetical results and are NOT an indicator of future results and do NOT represent returns that any investor actually attained. Indexes are unmanaged, do not reflect management or trading fees, and one cannot invest directly in an index. Additional information regarding the construction of these results is available upon request. Source Data: FactSet
As can be seen above, there is no clear-cut winner over the past decade+, with Value underperforming Growth for the EBIT/TEV and E/P variables.(6) Add in management fees and transaction costs, which will bring down the returns, and one sees that the past decade has not been great for Value investors.(7)
Turning our attention to developed International markets, what do we find there?
Below are the results to the International Universe over the full sample. Returns run from 1/1/1989-6/30/2019 and are gross of any management fees or transaction costs.
The results are hypothetical results and are NOT an indicator of future results and do NOT represent returns that any investor actually attained. Indexes are unmanaged, do not reflect management or trading fees, and one cannot invest directly in an index. Additional information regarding the construction of these results is available upon request. Source Data: FactSet
Remembering that the Universe CAGR over this time period was 6.84% and the EAFE returned 5.08%, one sees that over the entire time period, Value did better than Growth.
However, what about the last 10 years? While we know that Value lost to Growth in the U.S., how did Value perform internationally? Here are the results from 1/1/2009-6/30/2019, which are gross of any management fees or transaction costs.
Over the same time period, the Universe CAGR was 8.78% while the EAFE index delivered 7.35%. It should be noted (again), that the results above are for equal-weighted portfolios, while the Universe return is market-cap weighted. However, one should note that over the past decade+, Value has outperformed growth in developed international markets.
Now we can move onto the original questions:
- How many Value stocks should I hold? In other words, does more concentration to the Value factor make sense?
- How much variation is there amongst the different “Value” metrics?
We answer both of these below.
The Effects of Concentration
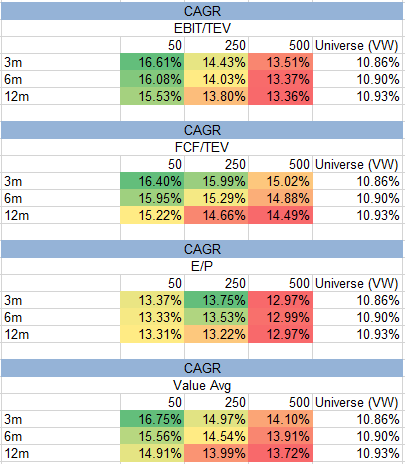
To examine the effects of concentration, the simplest approach is to vary the number of stocks that are held in the Value portfolio. For simplicity, I chose 3 options: The top 50, 250, or 500 Value stocks.
So every month (with the holding period varying from 3 to 6 to 12 months), I pick the top N Value stocks on each of the measures described above.
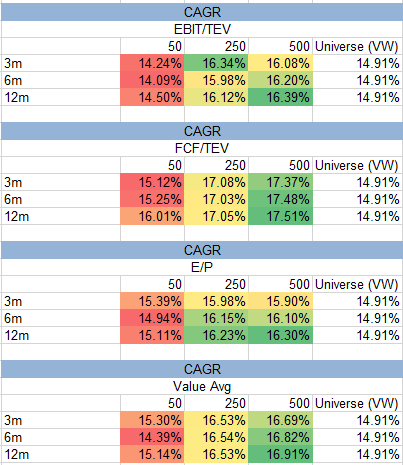
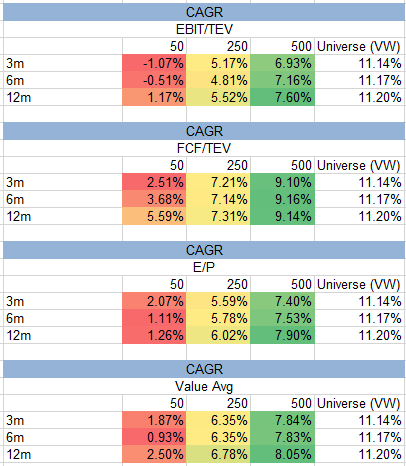
Below are the results within the U.S. Universe over the entire sample period (1/1/1989-6/30/2019) which are gross of any management fees or transaction costs.
The results are hypothetical results and are NOT an indicator of future results and do NOT represent returns that any investor actually attained. Indexes are unmanaged, do not reflect management or trading fees, and one cannot invest directly in an index. Additional information regarding the construction of these results is available upon request. Source Data: FactSet
Given that Value beat Growth over this time sample, what one finds is that on average, the more concentrated the portfolio (on average), the higher the CAGR over this time period (especially when keeping the holding period the same). Additionally, over the full-time period, while there is deviation amongst the Value metrics, they are generally similar in CAGR performance.
However, as Wes points out here, factor investing can be simple, but not easy.
What is not easy about this?
Well, for some (I’d argue “most” investors) investors, they do not like tracking error, which can simply be explained as deviations from the benchmark index.
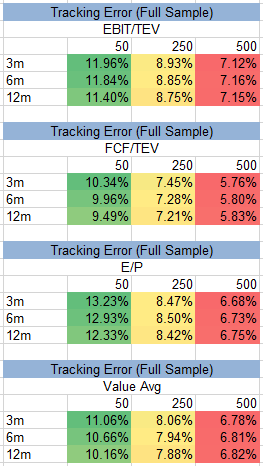
Below I examine the tracking error of the various Value portfolios relative to the R1k index over the entire time period. The results are below:
The results are hypothetical results and are NOT an indicator of future results and do NOT represent returns that any investor actually attained. Indexes are unmanaged, do not reflect management or trading fees, and one cannot invest directly in an index. Additional information regarding the construction of these results is available upon request. Source Data: FactSet
As can be seen above, the more concentrated the portfolio, the more deviation one will take from the index. The tracking error can go both ways, meaning one can win or lose relative to the index.
To highlight this fact, below are the results over the past decade+ (1/1/2009-6/30/2019):
The results are hypothetical results and are NOT an indicator of future results and do NOT represent returns that any investor actually attained. Indexes are unmanaged, do not reflect management or trading fees, and one cannot invest directly in an index. Additional information regarding the construction of these results is available upon request. Source Data: FactSet
As we know, over this time period, Growth generally did better than Value–thus, as one includes more growth firms (by selecting more Value firms, thereby diluting the Value investing trade), one would have been better off from a CAGR perspective within the U.S. over the past decade+.
But what happened in developed international markets?
The results are shown below for the entire time period (1/1/1989-6/30/2019) and are gross of any management fees or transaction costs.
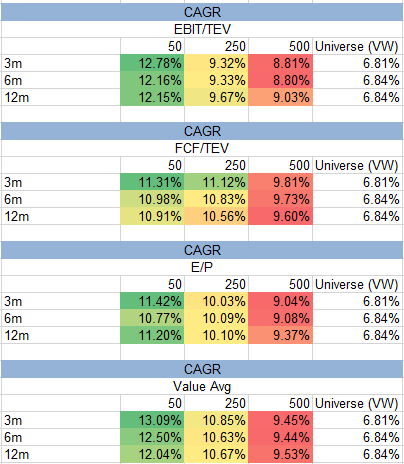
The results are hypothetical results and are NOT an indicator of future results and do NOT represent returns that any investor actually attained. Indexes are unmanaged, do not reflect management or trading fees, and one cannot invest directly in an index. Additional information regarding the construction of these results is available upon request. Source Data: FactSet
As we can see, over a time period when Value beat Growth, taking a more concentrated bet on the Value factor (similar to the U.S. market) was a better bet from a CAGR perspective.
However, similar to the U.S., there is no free lunch.
Taking on additional Value concentration risk come with higher tracking error relative to the EAFE index. This is shown below for the full sample (1/1/1989-6/30/2019):
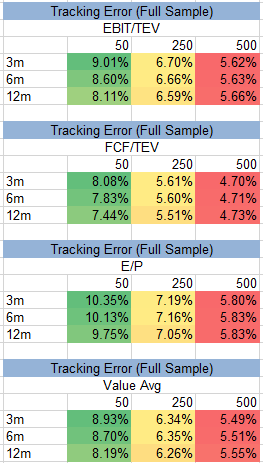
The results are hypothetical results and are NOT an indicator of future results and do NOT represent returns that any investor actually attained. Indexes are unmanaged, do not reflect management or trading fees, and one cannot invest directly in an index. Additional information regarding the construction of these results is available upon request. Source Data: FactSet
As was shown in the previous section, within developed international markets, Value (in general) beat growth over the past decade+.
However, what was the impact of concentration?
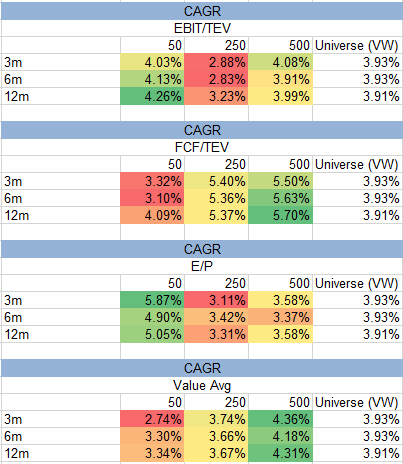
The results below are over the past decade+ (1/1/2009-6/30/2019) for developed international markets:
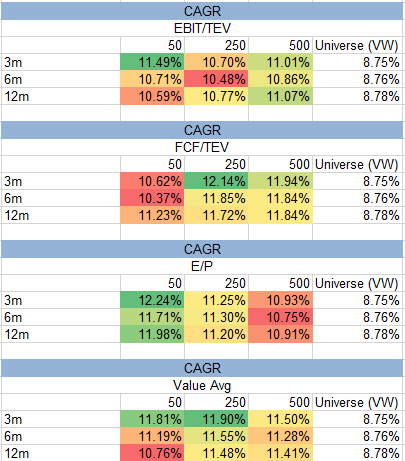
The results are hypothetical results and are NOT an indicator of future results and do NOT represent returns that any investor actually attained. Indexes are unmanaged, do not reflect management or trading fees, and one cannot invest directly in an index. Additional information regarding the construction of these results is available upon request. Source Data: FactSet
Here while there is not a clear linear relationship between concentration and CAGR, using some of the variations (3-month rebalance for EBIT/TEV, E/P, and the Value Average), we see that more concentrated portfolios did slightly better on a CAGR basis. However, we do see that Value (equal-weighted portfolios) outperformed the market-cap weighted market universe returns.
The Past 5 Years …
However, 10-year periods can mask the relative under/over performance over shorter time periods. For example, here are the returns over the past 5 years (7/1/2014-6/30/2019) for the U.S. universe.
The results are hypothetical results and are NOT an indicator of future results and do NOT represent returns that any investor actually attained. Indexes are unmanaged, do not reflect management or trading fees, and one cannot invest directly in an index. Additional information regarding the construction of these results is available upon request. Source Data: FactSet
Painful.
The above shows that over this time period and within the U.S. stock market, deep value stocks (the top 50) vastly underperformed the market (and growth stocks). In addition, using multiple Value metrics (the Value average measure) did little to mute the relative underperformance.
Similarly, here are the returns within the developed international markets over the same time period (7/1/2014-6/30/2019).
The results are hypothetical results and are NOT an indicator of future results and do NOT represent returns that any investor actually attained. Indexes are unmanaged, do not reflect management or trading fees, and one cannot invest directly in an index. Additional information regarding the construction of these results is available upon request. Source Data: FactSet
As can be seen above, concentration (in general) was not as harmful from a CAGR perspective compared to the U.S. over the same time period.
Recap and Takeaways:
First, let us recap the results:
- Over the long-run, Value beat Growth. However, it has lagged (especially in the U.S.) for a decade+. The past 5 years within the U.S. have definitely been painful for concentrated Value investors, and have caused some to question the efficacy of Value going forward.
- Concentration towards the Value factor was a good bet (in the past); however, it causes additional tracking error which can cause underperformance, such as the past 5 years within the U.S. market.
- The results are not identical across the U.S. and international markets, for example, Value has worked Internationally for the past decade+.
So what should one make of the results above?
It is always a good time to identify what one believes as an investor.
Rather than go through the myriad of beliefs an investor can have, here are a few we have:
- We believe in Value investing, which is a method to select stocks that are cheaper (on some multiple) than the market and growth stocks. A primer can be found here, alongside evidence from other firms, such as AQR.(8)
- We believe that characteristics drive returns. As such, we prefer to select cheap firms using our preferred method of EBIT/TEV, tilting the portfolio to stocks with a higher EBIT/TEV characteristic (As well as additional screens for quality).(9)
- Factor investing is simple, but not easy. While tracking error may be an issue for some, we embrace this construction. Why? Well if one believes that (1) value will work (over the long-run, of course, not guaranteed!), (2) characteristics drive returns, and (3) tracking error is something to be embraced, then consider the information below.
Below are the Average values, on each Valuation metric, for the top N Value firms within the U.S. as of 6/30/19.
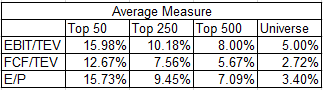
The results are hypothetical results and are NOT an indicator of future results and do NOT represent returns that any investor actually attained. Indexes are unmanaged, do not reflect management or trading fees, and one cannot invest directly in an index. Additional information regarding the construction of these results is available upon request. Source Data: FactSet
Similarly, below are the Average values, on each Valuation metric, for the top N Value firms within the developed international markets as of 6/30/19.
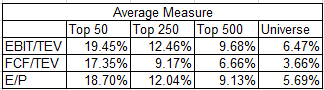
The results are hypothetical results and are NOT an indicator of future results and do NOT represent returns that any investor actually attained. Indexes are unmanaged, do not reflect management or trading fees, and one cannot invest directly in an index. Additional information regarding the construction of these results is available upon request. Source Data: FactSet
As one can see above, the more concentrated the Value stock portfolio, the higher the EBIT/TEV, FCF/TEV, and E/P yields. Of course, those yields may rise or fall in the future, due to either rising/falling numerators/denominators, but, systematic Value investing takes a systematic bet on higher-yielding securities.
It will not work all the time (see the past 5 years), but it is still something we believe.
So for those who may look at the market, see high valuations, and be looking for an alternative (cheaper) investment, a concentrated value portfolio still offers that today.
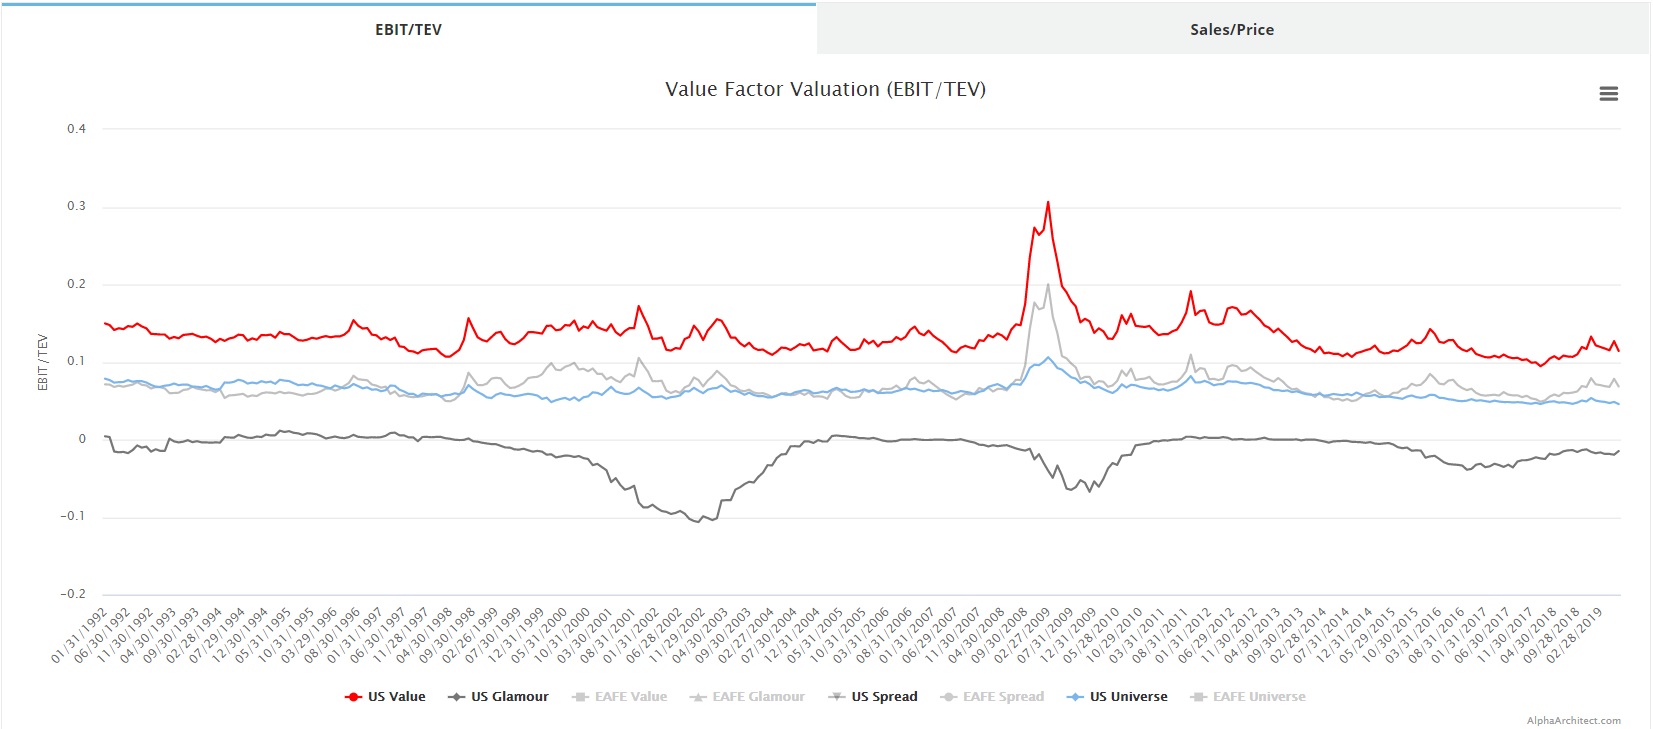
PS: For those interested in seeing the Value/Growth multiples across time, feel free to use our “Visual Factors” tool (image below):
PPS: A pet peeve of mine is the following–an investor indicates that (1) it is impossible to beat the market (I’d disagree as I think certain strategies have a chance of winning, but the math dictates that the average return will be the market return minus fees, so on net, I’ll agree with that point) and (2) U.S. returns will be low in the future due to higher valuations (I’m fine with this belief) and (3) value investing won’t work. It is part 3 that baffles me, as one cannot logically conclude from (1) and (2) that market returns will be low in the future due to high valuations, yet then at the same time conclude a diversified portfolio of value stocks, with cheaper valuations, will underperform the market. Either valuations matter or they don’t.(10)

References[+]
| ↑1 | Note that I did a similar analysis here. This post adds other value metrics as well as examines developed international stocks. In addition, there is a great article by Patrick O’Shaughnessy here on the topic. Last, Wes examines this topic in a related manner here. |
|---|---|
| ↑2 | The difference in the starting time period is due to data availability. |
| ↑3 | Note, one can attempt to create this variable for financial stocks, but in this instance, I simply examined firms with the information. |
| ↑4 | For a good article on timing luck, read Corey’s post here. |
| ↑5 | This can be due to a myriad of reasons, such as (1) the EAFE index using a different rebalance frequency, (2) we select the top 1,000 developed International stocks, whereas there are ~ 920 stocks currently in the EAFE index, (3) free-float requirements. However, the high correlation indicates that the universe generally moves along with the respective index. |
| ↑6 | As can be seen, FCF/TEV and the Value Avg. did perform slightly better than Growth over this time period. |
| ↑7 | However, it’s not as bad as some make it out to be! |
| ↑8 | Note, there are other methods, such as discounting cash flows and firm valuation, that one can employ to engage in value investing (buying a stock that your model says is undervalued). Using multiples is one systematic method that can minimize inherent biases in the valuation process (for example, future growth rates on revenue, discount rates, etc.) |
| ↑9 | Here is a paper, forthcoming in the JPM, that outlines why we prefer enterprise multiples. |
| ↑10 | It should be noted, that value stocks will almost always trade at a discount to the market, and the “basket” of stocks in the value portfolio (as well as other factors) will deviate (from rebalance to rebalance), while the market “basket” will not deviate as much from month-to-month, even over a 1 to 5 year time period. In addition, growth rates for revenues, earnings, etc. will vary amongst the value/growth firms. |
About the Author: Jack Vogel, PhD
—
Important Disclosures
For informational and educational purposes only and should not be construed as specific investment, accounting, legal, or tax advice. Certain information is deemed to be reliable, but its accuracy and completeness cannot be guaranteed. Third party information may become outdated or otherwise superseded without notice. Neither the Securities and Exchange Commission (SEC) nor any other federal or state agency has approved, determined the accuracy, or confirmed the adequacy of this article.
The views and opinions expressed herein are those of the author and do not necessarily reflect the views of Alpha Architect, its affiliates or its employees. Our full disclosures are available here. Definitions of common statistics used in our analysis are available here (towards the bottom).
Join thousands of other readers and subscribe to our blog.