Investigating the relationship between risk and return
- David Blitz, Pim van Vliet, and Guido Baltussen
- A version of the paper can be found here.
- Want a summary of academic papers with alpha? Check out our Academic Research Recap Category.
What are the research questions?
One dirty little secret that has been hiding behind the curtains of finance for a long time, is that high-risk stocks do not have higher returns than low-risk stocks. Back in 1975 Haugen and Heins first recognized the low-risk anomaly:
Our emperical efforts do not support the conventional hypothesis that risk – systemic or otherwise – generates a special reward. Indeed, our results indicate that, over the long run, stock portfolios with lesser variance in monthly returns have experienced greater average returns than their riskier counterparts. Haugen and Heins [1975]
This paper looks to review the data and give an overview of the low-risk anomaly and answer these questions:
- What is the empirical evidence for the low-risk effect?
- Is the low-risk anomaly low-volatility or low-beta?
- Is low-risk a distinct effect?
- How can we capture the low-risk effect?
What are the Academic Insights?
- The evidence for the low-risk effect goes back to the earliest asset pricing studies in the nineteen seventies. Starting in 1972 and 1973 respectively Miller and Scholes, then Fama and MacBeth found that although higher risk is associated with higher return, it’s not rewarded enough. Then Haugen and Heins found that additional risk was not being rewarded with additional returns. Following these early developments, it wasn’t until 1992 that Fama and Frech found that market beta is entirely unpriced in the cross-section of stock returns when size and beta are separated out. Shumway [1997] and Shumway and Warther [1999] discovered that old data in CRSP were biased due to incorrect specification of bankruptcies, which happens to occur in small/risky stocks. As a result of this bias risk and return appeared more positive than it actually was. Then in 2007 Blitz and Vliet again looks at the low-risk effect and find that over their 20 year sample period, the relationship between is not just flat but inverted, with a top minus bottom CAPM-alpha spread of 12% per annum. Additionally, in this paper Blitz and Vliet find that the low-risk effect is robust across geographic regions. Most recent research (2015-present) has been focused on testing the low-risk anomaly for robustness across regions, markets and times, as well as showing that it is not concentrated in small uninvestable equities.
- Firstly the research team notes that volatility and beta are closely-related metrics. When you dig into the mathematics of beta, essentially defining low-risk based on volatility or beta is effectively a choice on the added value of correlations (beta is the one that utilizes correlations). In 2019 Asness, Frazzini, Gormsen, and Pedersen dive into the components of beta; volatility and correlation. Their results show that volatility is the main driver of the low-risk effect and that the added value of correlations is a second-level effect.
- When considering if low-risk is a distinct effect the research team looked at 3 distinct factors that might explain the low- risk anomaly: 1. Interest Rate Risk, 2. Value, and 3. Profitability. In reviewing studies on each of these factors the research team concluded that at best they can explain only a very small part of the low-risk anomaly and none are able to give an outstanding explanation for the low-risk anomaly.
- When analyzing how to implement the low-risk strategy the authors came to 4 general conclusions:
- That it’s best to focus on a long-only low-risk strategy for two primary reasons. First, it’s generally long-only funds have lower management fees than long-short funds. The second rationale for focusing on the long side only is that the practice of shorting the riskiest stocks in the market can be difficult and expensive in practice.
- In a 2018 meta-analysis conducted by Van Vliet on the low-risk literature, he concluded that an efficient low-risk strategy should not have more than 30% turnover per annum.
- In regards to investing internationally or locally to deal with currency risk, the authors conclude that to best implement a low-risk strategy is to utilize international stocks in combination with derivatives to directly hedge out currency risk.
- The authors then admit to some of the pitfalls of low-risk investing:
- Since the riskiness of stocks can change over time, this is an active strategy that comes with the challenges of active management.
- Low-risk research has tended to use simplistic rebalancing rules that work in backtesting but may not work in a real-world application.
- Due to the transparency of low-risk strategies they become vulnerable to index arbitrage(1).
- In addition to the pitfalls, the authors also conclude that due to it’s being a completely unique factor uncorrelated with value and momentum, the low-risk anomaly lends itself well to being combined well with other factors.
Why does it matter?
Whereas anomolies such as size and value imply that the CAPM may beed to be augmented with some additional factors, the low risk anomaly challenges the heart of the CAPM, i.e. the very notion that higher risk should be rewarded with higher return in the cross-section. David Blitz, Pim van Vliet, and Guido Baltussen, The Volatility Effect, August 26, 2019
These authors have concluded that the low-risk anomaly is a unique factor that is under-appreciated and is not arbitraged out of the market for several reasons. Furthermore, they believe that when combining the low-risk anomaly with other factors such as value and momentum you can build what they call a “conservative formula” that outperforms both the market and a low-risk generic low-volatility approach.
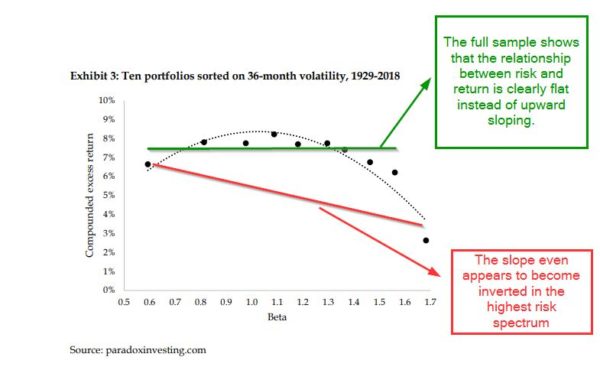
The most important chart from the paper:

About the Author: Rich Shaner, CFA
—
Important Disclosures
For informational and educational purposes only and should not be construed as specific investment, accounting, legal, or tax advice. Certain information is deemed to be reliable, but its accuracy and completeness cannot be guaranteed. Third party information may become outdated or otherwise superseded without notice. Neither the Securities and Exchange Commission (SEC) nor any other federal or state agency has approved, determined the accuracy, or confirmed the adequacy of this article.
The views and opinions expressed herein are those of the author and do not necessarily reflect the views of Alpha Architect, its affiliates or its employees. Our full disclosures are available here. Definitions of common statistics used in our analysis are available here (towards the bottom).
Join thousands of other readers and subscribe to our blog.