Value and Momentum each had back to back extreme returns (five sigma) days on Monday, September 9th and Tuesday, September 10th. The Dow Jones Thematic Market Neutral Value Index (“Value”) started the week up 3.45%, its best day since inception on December 31st, 2001. The Value Index followed this up on Tuesday, September 10th with a 2.56% return, its 7th best day since inception. The Dow Jones Thematic Market Neutral Momentum Index (“Momentum”) was down 4.53% and 4.08%, its two worst days in the past 10 years (10th and 15th worst days since inception).
Figure 1A shows the distribution of single-day returns for the Value Index:
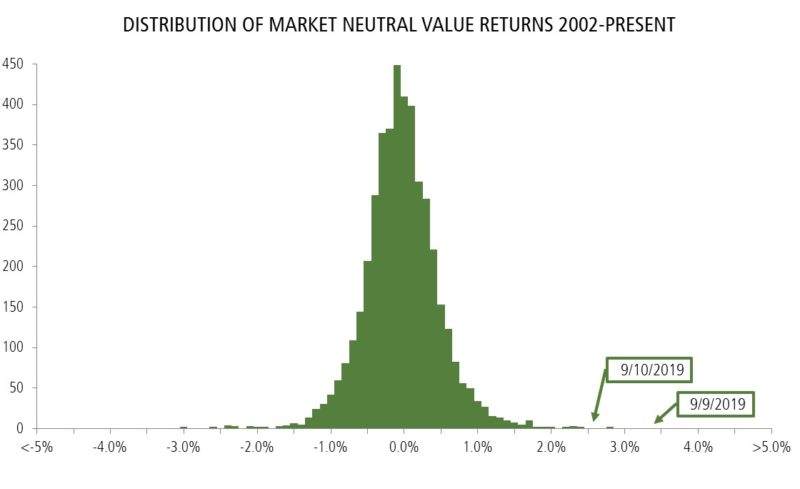
Figure 1B shows the distribution of single-day returns for the Momentum Index:
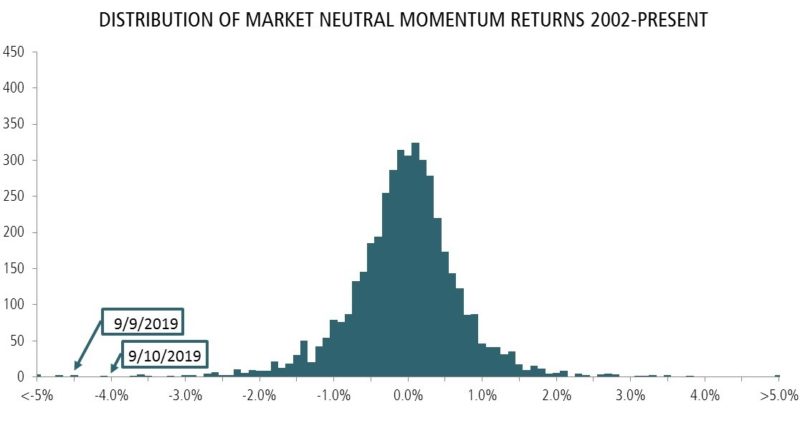
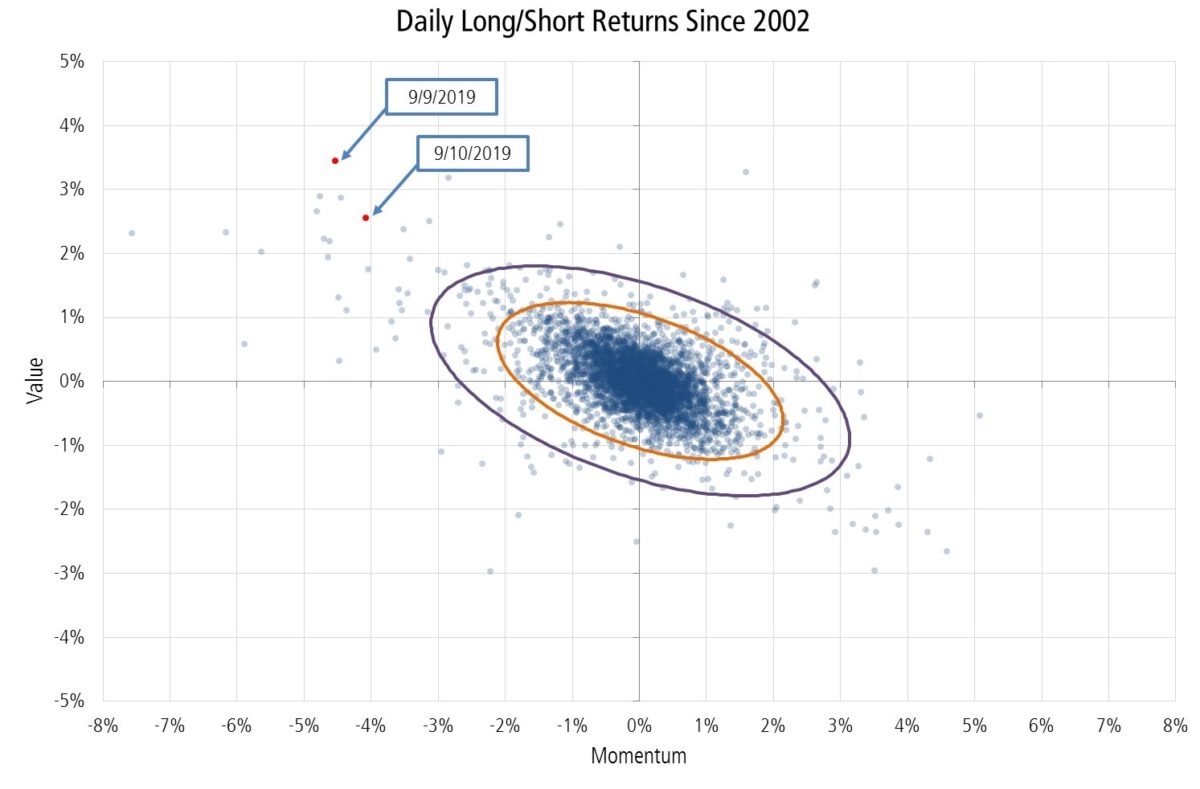
Figure 2 shows us that it is normal for Momentum and Value to move in opposite directions. The red points mark the past two days’ observations. All but one of the points to the left of these are from the early part of the 2009 recovery – the last momentum crash. The orange ellipse contains points within two standard deviations of the mean and the purple ellipse contains 95% of the samples.
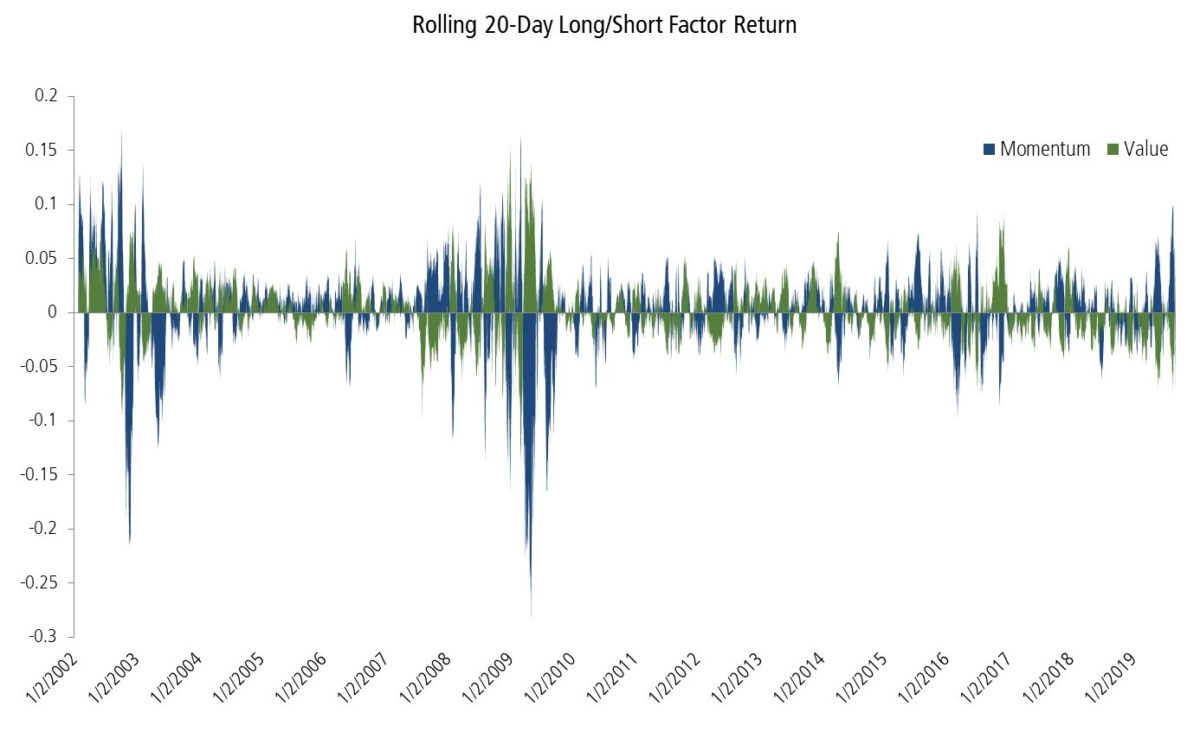
It is an understatement to say that the recent factor moves are rare. This is the sort of thing that factor geeks wait decades for. The good news for those of us fitting that description is that these sorts of events tend to cluster. This is evident from Figure 3, which shows historic rolling 20-day returns for the two-factor indexes. Figure 3, also shows us that sharp reversals in these factors are the norm. In fact, the worst day for Momentum was April 9, 2009 (down 7.56%). Seven market days later, on April 20, 2009, Momentum had its best day (up 10.35%)!
One last point, volatility in these indices is typically high around regime changes and big market moves. While a lot has changed recently (I would argue we entered a new regime in Q4 2018) the S&P 500 is up only 3% from where it was 12 months ago. It wouldn’t surprise me to see a few more large moves in Momentum and Value in the near future. (1)

References[+]
| ↑1 |
IMPORTANT INFORMATION The strategy outlined is not currently offered and as such, no clients are invested in this strategy. It is purely hypothetical and the performance returns and other statistics were calculated by QS Investors using published data sources, which have been noted throughout this paper. This material is intended for informational purposes only and it is not intended that it be relied on to make any investment decision. It was prepared without regard to the specific objectives, financial situation or needs of any particular person who may receive it. It does not constitute investment advice or a recommendation or an offer or solicitation and is not the basis for any contract to purchase or sell any security or other instrument, or QS Investors, LLC to enter into or arrange any type of transaction as a consequence of any information contained herein. QS Investors, LLC does not give any warranty as to the accuracy, reliability or completeness of information which is contained in this document. Except insofar as liability under any statute cannot be excluded, no member of QS Investors, LLC, the Issuer or any officer, employee or associate of them accepts any liability (whether arising in contract, in tort or negligence or otherwise) for any error or omission in this document or for any resulting loss or damage whether direct, indirect, consequential or otherwise suffered by the recipient of this document or any other person. |
|---|
About the Author: Josh Russell, PhD, CFA
—
Important Disclosures
For informational and educational purposes only and should not be construed as specific investment, accounting, legal, or tax advice. Certain information is deemed to be reliable, but its accuracy and completeness cannot be guaranteed. Third party information may become outdated or otherwise superseded without notice. Neither the Securities and Exchange Commission (SEC) nor any other federal or state agency has approved, determined the accuracy, or confirmed the adequacy of this article.
The views and opinions expressed herein are those of the author and do not necessarily reflect the views of Alpha Architect, its affiliates or its employees. Our full disclosures are available here. Definitions of common statistics used in our analysis are available here (towards the bottom).
Join thousands of other readers and subscribe to our blog.