The Size Premium in Equity Markets: Where Is the Risk?
- Stefano Ciliberti, Emmanuel Sérié, Guillaume Simon, Yves Lempérière, and Jean-Philippe Bouchaud
- Journal of Portfolio Management
- A version of this paper can be found here
- Want to read our summaries of academic finance papers? Check out our Academic Research Insight category
The size premium is one of the factors that we have researched and dug into several times on the blog. You can find just a few here, here, and here. This paper though took a fresh look at the size premium and adds a new perspective that we haven’t previously covered.
What are the research questions?
- Given various approaches to measuring the “size” of a company, is the total amount of daily traded dollars in a stock (ADV)(1) a better proxy for risk than SMB?
- Is CMH (“cold minus hot”) a better long term proxy for returns when compared to SMB?
What are the Academic Insights?
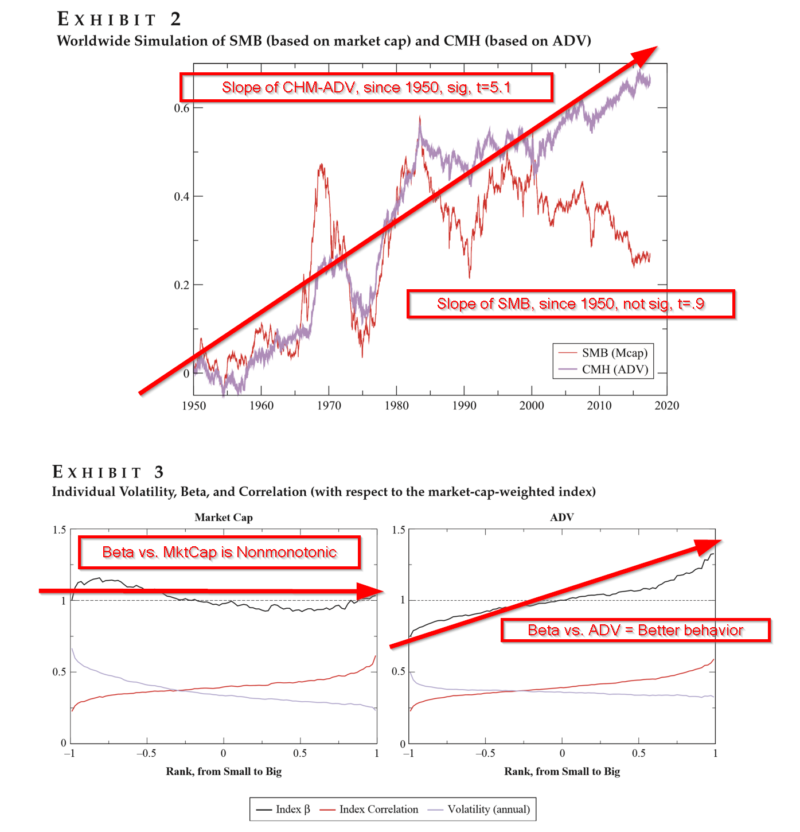
- MAYBE. The authors argue the use of market cap as a proxy for the size effect embeds biases in the L/S portfolio constructed to measure the SMB risk premium. Indeed, the lack of a clear relationship between beta and market cap (see left side of Exhibit 3) produces SMB portfolios with a significant low volatility exposure on the short side. Very small and very large-cap stocks have betas less than 1, while midcaps have betas larger than 1, a nontrivial result. A substitute (ADV—average daily transaction volume) is proposed with a better-behaved relationship with beta (see right side of Exhibit 3). ADV is conventionally used by practitioners as a measure of liquidity, although little is found in the academic literature regarding its’ use. For a stock, it represents the difficulty of unwinding a large position with little impact costs. The idea here is that the ADV measure can be used to determine a set of L/S portfolios (referred to as “cold” and “hot”) whose return would represent compensation for bearing liquidity risk.
- YES. ADV portfolios are less associated with the beta and low volatility biases noted previously and is, therefore, a better substitute for the market cap based construction of the risk factor, SMB. Cold stocks trade at a discount due to the difficulty associated with liquidity and Hot stocks are subject to heavier market scrutiny and therefore exhibit less mispricing. The profitability of the CMH set of portfolios is shown in Exhibit 2, where the t-stat on the slope is significant at 5.1 over not quite 70 years. The empirical argument that a risk premium label be attached to CMH portfolios, is the empirical observation that significant drawdowns are more often observed for small-cap/ADV stocks. However, the theoretical rationale and other empirical attributes of ADV/CMH require more work.
Why does it matter?
The ADV liquidity measure is not in widespread use in the finance literature, although, two papers (Datar, Naik, and Radcliffe, 1998; Idzorek, Xion, and Ibbotson, 2012) did tie it to long-term returns. Given at least that level of supporting research, the CMH formulation may have appeal to portfolio managers, portfolio construction technologies, and empirical methods used for risk adjustment. This paper matters because it represents interesting exploratory work on the debate over the existence of a size risk premium. I think it’s promising.
The most important chart from the paper
Abstract
The authors find that when measured in terms of dollar-turnover, and once β and low volatility (low-vol) is neutralized, the size effect is alive and well. With a long-term t-statistic of 5.1, the cold-minus-hot (CMH) anomaly is certainly not less significant than other well-known factors such as value or quality. As compared to market-cap–based SMB, the authors report that CMH portfolios are much less anti-correlated to the low-vol anomaly. In contrast with standard risk premiums, size-based portfolios are found by the authors to be virtually unskewed. In fact, they report that the extreme risk of these portfolios is dominated by the large-cap leg; small caps actually have a positive (rather than negative) skewness. The only argument that the authors find favors a risk premium interpretation at the individual stock level is that the extreme drawdowns are more frequent for small-cap/turnover stocks, even after accounting for volatility. According to the authors, however, this idiosyncratic risk is clearly diversifiable and should not, in theory, generate higher returns.

About the Author: Tommi Johnsen, PhD
—
Important Disclosures
For informational and educational purposes only and should not be construed as specific investment, accounting, legal, or tax advice. Certain information is deemed to be reliable, but its accuracy and completeness cannot be guaranteed. Third party information may become outdated or otherwise superseded without notice. Neither the Securities and Exchange Commission (SEC) nor any other federal or state agency has approved, determined the accuracy, or confirmed the adequacy of this article.
The views and opinions expressed herein are those of the author and do not necessarily reflect the views of Alpha Architect, its affiliates or its employees. Our full disclosures are available here. Definitions of common statistics used in our analysis are available here (towards the bottom).
Join thousands of other readers and subscribe to our blog.