Responsible Investing: The Environmental, Social, and Governance (ESG) – Efficient Frontier
- Lasse Heje Pedersen, Shaun Fitzgibbons, and Lukasz Pomorski
- Working Paper
- A version of this paper can be found here
- Want to read our summaries of academic finance papers? Check out our Academic Research Insight category
What are the research questions?
- What is the importance of the main theoretical result for ESG investing?
- In terms of the costs and benefits of ESG investing as predicted by the ESG efficient frontier does screening out the worst ESG companies impact the ESG-EF? or…
- Does ESG information predict future company fundamentals? or…
- Does ESG information predict future investor demand for a given stock? or…
- Does ESG information predict future returns?
What are the Academic Insights?
- In this paper, the authors develop the ESG-SR (Sharpe Ratio) efficient frontier and show conditions when ESG attributes will produce positive or negative returns in equilibrium. Propositions published previously in the literature center on the idea that ESG investors will not hold specific non-ESG companies in portfolios, therefore segmenting the market for these assets. Higher expected returns accruing to non-ESG companies will be driven by such market segmentation and, in equilibrium values-driven investors will prefer high ESG companies that have lower expected returns. Although the larger theoretical discussion in this article extends the literature on ESG investing, from a practical point of view, the most significant contribution is the theory’s ability to explain why certain specific ESG attributes predict a positive (e.g. Governance) return and others predict a negative (e.g. non-Sin) or zero (e.g. low Emissions) return. To reconcile these dimensions, the authors draw from two points of view: ESG attributes influence the preferences of values-based investors while also signaling information about expected risk and return. Woven together, the two threads allow for a number of nontrivial testable outcomes in terms of ESG attributes and future returns.
- YES, BUT NOT IN A GOOD WAY. Restricting the universe of stocks by screening out ESG companies shifts the EF downward, not a surprising result. What is surprising is that portfolios that screen out low ESG companies, may build an optimal portfolio that has lower ESG exposures than if the screen was not used. The authors explain the intuition: low ESG companies allow an unconstrained investor the opportunity to increase the portfolio Sharpe ratio via the purchase of high ESG companies with funds from shorting low ESG companies; low ESG companies that enter into a portfolio may act as a hedge, thus increasing the Sharpe ratio for the portfolio.
- YES. To conclude that ESG information will generate positive returns, the ESG measure must be correlated with future fundamentals as a necessary but not sufficient condition. The authors estimated pooled regressions (including all FF factors) and Fama-MacBeth regressions for companies included in the SP500 and used four ESG attributes (accruals, low emissions, ESG scores, non-Sin designation) to assess this proposition. They find evidence that accruals and low emission companies are significantly related to future RNOA (return on net operating assets). There was no relationship between ESG scores (from MSCI) or non-Sin companies and future RNOA. There is also evidence reported that all four measures of ESG attributes are related to profitability (gross profits/assets).
- YES. To generate positive returns, proxies for ESG attributes must be related to investor demand as well as future fundamentals. All four ESG proxies were significantly related to three investor interest variables: institutional holdings, trading activity, and signed order flow. Same methodology as in #3.
- SOMEWHAT. This was the weakest part of the empirical analysis of the conditions necessary to support the theoretical ESG EF. Stocks were sorted into ESG quintiles or two portfolios monthly, long/short spreads were calculated and analyzed with respect to the four proxies for ESG attributes using the CAPM, 3-,5- and 6-factor FF risk models (including momentum). The strongest and most substantial relationship was observed between accruals and future returns. Next up, was the Sin premium (50% split long/short) exhibiting a weak relationship that disappeared with the 5- and 6-factor FF adjustments. No relationship was observed between low emissions and ESG-MSCI scores with future returns under any risk model scenario. The authors also examine the contemporaneous relationship between book-to-market (as a valuation measure). More thought should be given as to the use of book-to-market as a proxy for valuation and its importance. The empirical failure of this ratio to predict returns is well-known and presents a conflict in the results reported here.
Why does it matter?
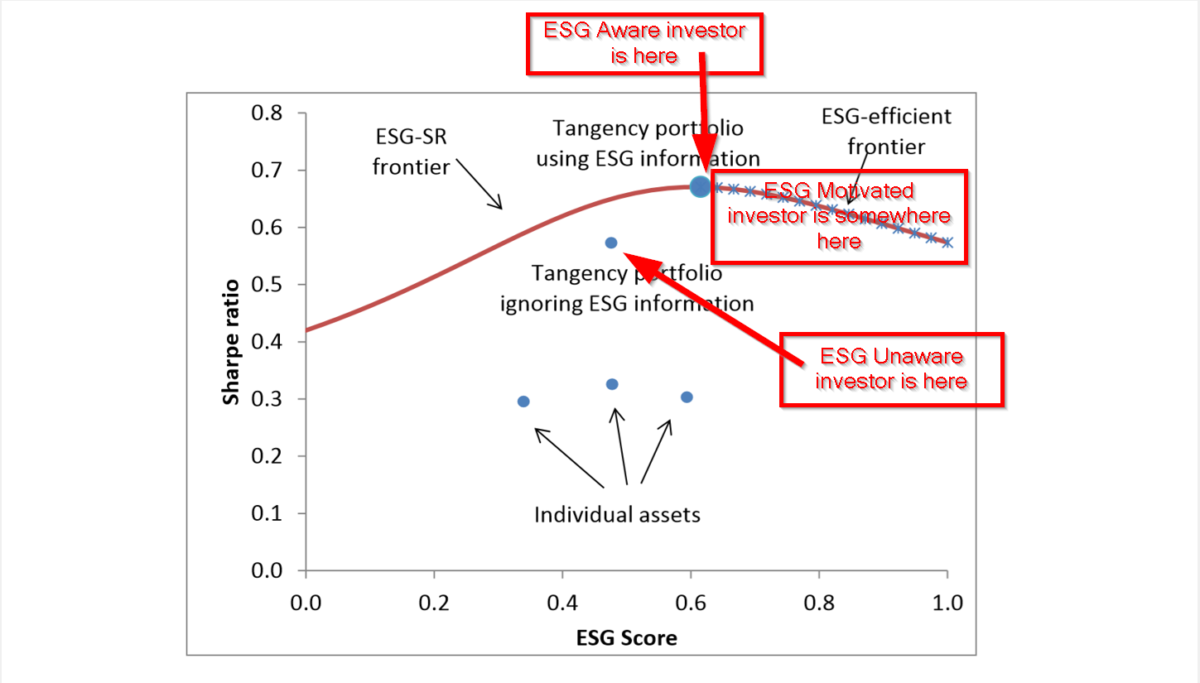
The authors make complete and convincing theoretical arguments that are graphically represented in the ESG EF. As a result, costs are evaluated via declines in the Sharpe ratio when optimal ESG portfolios are compared to the portfolio with the maximum Sharpe ratio portfolio. Corresponding increases in the maximum Sharpe ratio associated with ESG attributes, illustrate the benefits relative to the non-ESG EF. This is a considerable extension of the research published on ESG thus far. In that respect, I believe it will make a significant impact on explaining the conflicting results we see in the empirical ESG literature.
The most important chart from the paper
Abstract
We propose a theory in which each stock’s environmental, social, and governance (ESG) score plays two roles: 1) providing information about firm fundamentals and 2) affecting investor preferences. The solution to the investor’s portfolio problem is characterized by an ESG-efficient frontier, showing the highest attainable Sharpe ratio for each ESG level. The corresponding portfolios satisfy four-fund separation. Equilibrium asset prices are determined by an ESG-adjusted capital asset pricing model, showing when ESG increases or lowers the required return. Combining several large data sets, we compute the empirical ESG-efficient frontier and show the costs and benefits of responsible investing. Finally, we test our theory’s predictions using commercial ESG measures, governance, sin stocks, and carbon emissions.

About the Author: Tommi Johnsen, PhD
—
Important Disclosures
For informational and educational purposes only and should not be construed as specific investment, accounting, legal, or tax advice. Certain information is deemed to be reliable, but its accuracy and completeness cannot be guaranteed. Third party information may become outdated or otherwise superseded without notice. Neither the Securities and Exchange Commission (SEC) nor any other federal or state agency has approved, determined the accuracy, or confirmed the adequacy of this article.
The views and opinions expressed herein are those of the author and do not necessarily reflect the views of Alpha Architect, its affiliates or its employees. Our full disclosures are available here. Definitions of common statistics used in our analysis are available here (towards the bottom).
Join thousands of other readers and subscribe to our blog.