Are you doing independent factor research? Have you spent countless hours on Ken French’s website? Do you run factor regressions for “fun”?
Congrats — you are officially a finance geek and you will probably benefit from our new factor investing library.
Our library has over 300 factors to choose from and has data available from 92 to the most recent period.
The factors are built across the following dimensions and can be used for research purposes with an appropriate citation.
- 3 Markets = US (Top 1500), Developed (Top 1500), or Canada (Top 150)
- 2 Weightings = Value-weighted (i.e., market-cap weighted) or equal-weighted
- 3 Splits = Tercile (Canada-only) or decile/quintile (US and Developed)
- 25+ Characteristic = EBIT/TEV, B/P, 2-12 Mom, and so forth (see below)
- Please share any of your findings — curious to hear what the community finds. Happy to facilitate guest blog posts if you’d like to share far and wide.
- Here is a link to the site (requires registration, which is free).
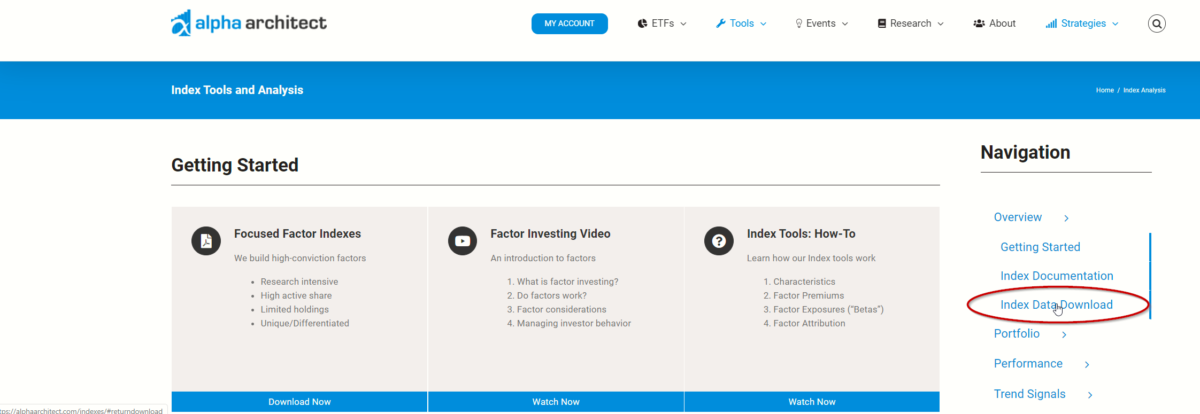
- If the link above doesn’t work, you can always navigate to our data download section via the right sidebar panel. Click on “Index Data Download.”
Factor Definitions
| Asset Growth | YoY growth rate in Total Assets | Quality |
| Beta | Measures beta using daily returns against the “local” index over a 252 day period | Volatility |
| Book/Price | Common Equity / Size | Value |
| Cash Flow/Price | (Net Income + Depreciation & Amortization + Deferred Taxes (if available)) / Size | Value |
| Debt Paydown Yield | (Total Debt 1 year ago minus Total debt today) / Market Capitalization | Value |
| Dividend/Price | Dividends per share / Price | Value |
| Earnings/Price | Earnings Per Share / Price | Value |
| EBIT/TEV | EBIT / Total Enterprise Value, where EBIT = Operating Income = Revenues – COGS – SGA and Total Enterprise Value = Current Market Capitalization + Preferred Stock (if available) + Debt (if available) + Minority Interest (if available) – Cash (if available) | Value |
| EBITDA/TEV | EBITDA / Total Enterprise Value, where EBITDA = EBIT + Depreciation + Amortization and Total Enterprise Value = Current Market Capitalization + Preferred Stock (if available) + Debt (if available) + Minority Interest (if available) – Cash (if available) | Value |
| Financial Strength Score | Financial Strength Score + tiebreaker (we use EBIT/TEV / 100 to create a continuous FS-Score Variable) | Quality |
| Gross Profit | (Sales – COGS) / lagged Total Assets | Quality |
| Momentum (1) | Total Return (in U.S. Dollar terms) over the prior 1 month. | Momentum |
| Momentum (1-12) | Total Return (in U.S. Dollar terms) over the prior 12 months. | Momentum |
| Momentum (1-6) | Total Return (in U.S. Dollar terms) over the prior 6 months. | Momentum |
| Momentum (2-12) | Total Return (in U.S. Dollar terms) over the prior 12 months, excluding last month. | Momentum |
| Price | Closing Price | N/A |
| Repurchase Yield | Total return over the past 12 months – (Current Market Capitalization / Market Capitalization 1 year ago). Measured at Month end. See http://www.kentdaniel.net/papers/published/jf_06.pdf. | Value |
| Return on Assets | Return on Assets | Quality |
| Return on Equity | Return on Equity | Quality |
| Sales/Price | Sales / Size | Value |
| Shareholder Yield | Dividend Yield + Repurchase Yield | Value |
| Shareholder Yield with Debt | Dividend Yield + Repurchase Yield + Net Debt Paydown Yield | Value |
| Size | Consolidated Market Capitalization | Size |
| Volatility | Measures volatility using the standard deviation of the daily total return over the past 252 trading days, and multiplies this by the square root of 252 | Volatility |

About the Author: Wesley Gray, PhD
—
Important Disclosures
For informational and educational purposes only and should not be construed as specific investment, accounting, legal, or tax advice. Certain information is deemed to be reliable, but its accuracy and completeness cannot be guaranteed. Third party information may become outdated or otherwise superseded without notice. Neither the Securities and Exchange Commission (SEC) nor any other federal or state agency has approved, determined the accuracy, or confirmed the adequacy of this article.
The views and opinions expressed herein are those of the author and do not necessarily reflect the views of Alpha Architect, its affiliates or its employees. Our full disclosures are available here. Definitions of common statistics used in our analysis are available here (towards the bottom).
Join thousands of other readers and subscribe to our blog.