Stock Market Returns and Consumption
- Marco Di Maggio, Amir Kermani and Kaveh Majlesi
- Journal of Finance, 2020
- A version of this paper can be found here
- Want to read our summaries of academic finance papers? Check out our Academic Research Insight category
What are the Research Questions?
Anyone who’s spent better than thirty-five minutes listening to financial news has likely heard about the “Wealth Effect.” The theory suggests that the upward trajectory in prices of assets lines the pockets of consumers itching to spend their newfound wealth. Financial news particularly loves the concept because it drives more spending and creates a flywheel effect on the stock market driving prices and ratings even higher. The authors of this paper inquire directly into analyzing if stock market trends drive household spending habits and whether this link depends on households’ overall wealth.
What are the Academic Insights?
By analyzing granular household-level data (on the universe of households’ portfolio holdings at the security level, as well as information about their debt obligations and real estate transactions) from Sweden during the period 1999-2007, the authors find:(1)
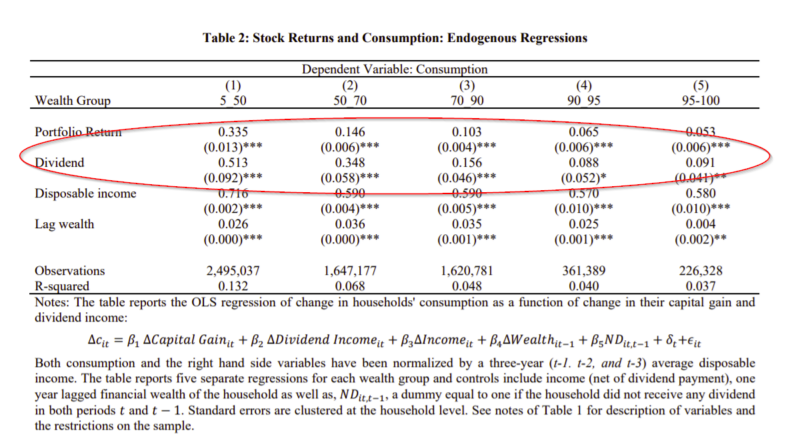
- The marginal propensity to consume (MPC) of (unrealized) capital gains for households in the top 50% of the financial wealth distribution is about 5% and it does not exhibit significant variation between, for instance, households in the 50th to 70th percentile and households in the top 5% of the wealth distribution. In contrast, the MPC for households in the bottom half of the distribution is significantly higher at about 13% ( even if this segment of the population owns less than 7% of overall stockholdings.
- Consistent with the evidence in Baker, Nagel, and Wurgler (2007), we find that households are significantly more responsive to changes in dividends. In fact, the MPC out of dividends, for all of our wealth groups, is around 35%, i.e. about seven times the MPC out of capital gains for the top 50th percentile of wealth distribution.
- Among households with enough financial wealth, MPC out of capital gains is significantly larger for older households. This finding is consistent with life cycle models.
These results on MPC out of dividends and capital gains are consistent with near-rational behavior in which households separately optimize their consumption with respect to capital gains and dividend income as if they were independent of each other. In particular, dividend income changes are significantly more persistent than changes in capital gains, and, as long as households consider capital gains and dividend income as separate sources of income, this can rationalize an MPC out of dividend income that is significantly larger than MPC out of capital gains ( see also the concept of free dividends fallacy by Hartzmark and Solomon, 2017, covered here).
Why does it matter?
This study fills the literature with findings on the causal impact of changes in stock market wealth on households’ consumption. For the amount of press it gets, we would have expected a larger Wealth Effect. Also, if politicians sought to exploit the wealth effect the data would suggest that they encourage firms to increase their dividend distributions as much as possible.
The Most Important Chart from the Paper:
Abstract
This paper employs Swedish data on households’ stock holdings to investigate how consumption responds to changes in stock market returns. We instrument the actual capital gains and dividend payments with past portfolio weights. Unrealized capital gains lead to a marginal propensity to consume of 23% for the bottom 50% of the wealth distribution and about 3% for the top 30% of the wealth distribution. Household consumption is significantly more responsive to dividend payouts across all parts of the wealth distribution. Our findings are consistent with households treating capital gains and dividends as separate sources of income.

About the Author: Wesley Gray, PhD
—
Important Disclosures
For informational and educational purposes only and should not be construed as specific investment, accounting, legal, or tax advice. Certain information is deemed to be reliable, but its accuracy and completeness cannot be guaranteed. Third party information may become outdated or otherwise superseded without notice. Neither the Securities and Exchange Commission (SEC) nor any other federal or state agency has approved, determined the accuracy, or confirmed the adequacy of this article.
The views and opinions expressed herein are those of the author and do not necessarily reflect the views of Alpha Architect, its affiliates or its employees. Our full disclosures are available here. Definitions of common statistics used in our analysis are available here (towards the bottom).
Join thousands of other readers and subscribe to our blog.