Investors care about more than just returns. They also care about risk. Thus, prudent investors include consideration of strategies that can provide at least some protection against adverse events that lead to left tail risk (portfolios crashing). The cost of that protection (the impact on expected returns) must play an important role in deciding whether to include them. For example, buying at-the-money puts, a strategy that eliminates downside risk, should have returns no better than the risk-free rate of return, making that a highly expensive strategy.
Campbell Harvey, Sandy Rattray, and Otto Van Hemert, authors of the 2021 book “Strategic Risk Management,” evaluated the costs of various defensive strategies to determine which ones offered the best and most cost-effective protection against market downturns—providing what they called “crisis alpha” when it was needed most (during the eight worst drawdowns and three recessions for the U.S. in the 34-year period 1985-2018). Following is a summary of their findings:
Long Puts (Buying Portfolio Insurance)
Rolling a long put option strategy is the most direct hedge against equity drawdowns, as it protects against sudden, severe selloffs. As expected, the strategy performed well during all eight equity drawdowns. However, as bear markets accelerated, the costs of the puts increased, making them even more expensive. Over the long term, the annualized excess return (above the risk-free rate) to the strategy was ‑7.4 percent. They also found that while out-of-the-money puts were cheaper than at-the-money puts on a per-unit basis, they provided a worse cost-benefit tradeoff because they did not provide much payoff in more gradual, prolonged drawdowns.
Similarly, a put strategy on corporate credits (using credit default swaps) also had negative returns on average, and even negative returns during two of the three recessions. However, it did produce a large positive return during the Great Financial Crisis (2007-09). The bottom line is that a credit put strategy was not as reliable as an equity put strategy, though the costs were much lower.
Gold
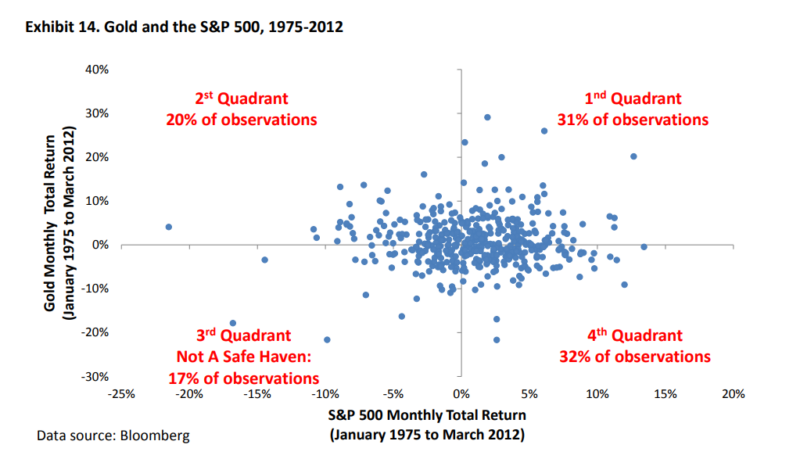
Many investors have traditionally considered gold to be a “safe haven” asset, expected to maintain or increase its value during equity and bond drawdowns. Gold did provide positive returns in seven of the eight equity drawdowns, providing an annualized return of 9 percent. However, outside of those eight drawdown periods, gold provided negative returns on average, resulting in a full-period return that was only marginally better than a flat nominal return. The authors also found that gold’s hedging abilities during the three recessions were marginal, with positive returns recorded in two of the three.
In their 2012 study, “The Golden Dilemma,” Claude Erb and Campbell Harvey found that 17 percent of monthly stock returns fell into the category where gold was falling at the same time stocks were posting negative returns. If gold acts as a true safe haven, then we would expect very few, if any, such observations. Still, 83 percent of the time on the right side isn’t a bad record. However, they also found that gold was a very unreliable inflation hedge unless your time frame was in centuries, not years, or even decades.
U.S. Treasury Bonds
Many investors have also viewed Treasury bonds as a safe-haven investment, likely because of the persistent downward trend in both inflation and interest rates over the 40 years prior to 2021. However, Harvey, Rattray, and Van Hemert found that the longer-term data reveals that bond returns were also negative during the worst quintile of equity returns over both the periods 1960-79 and 1980-99.
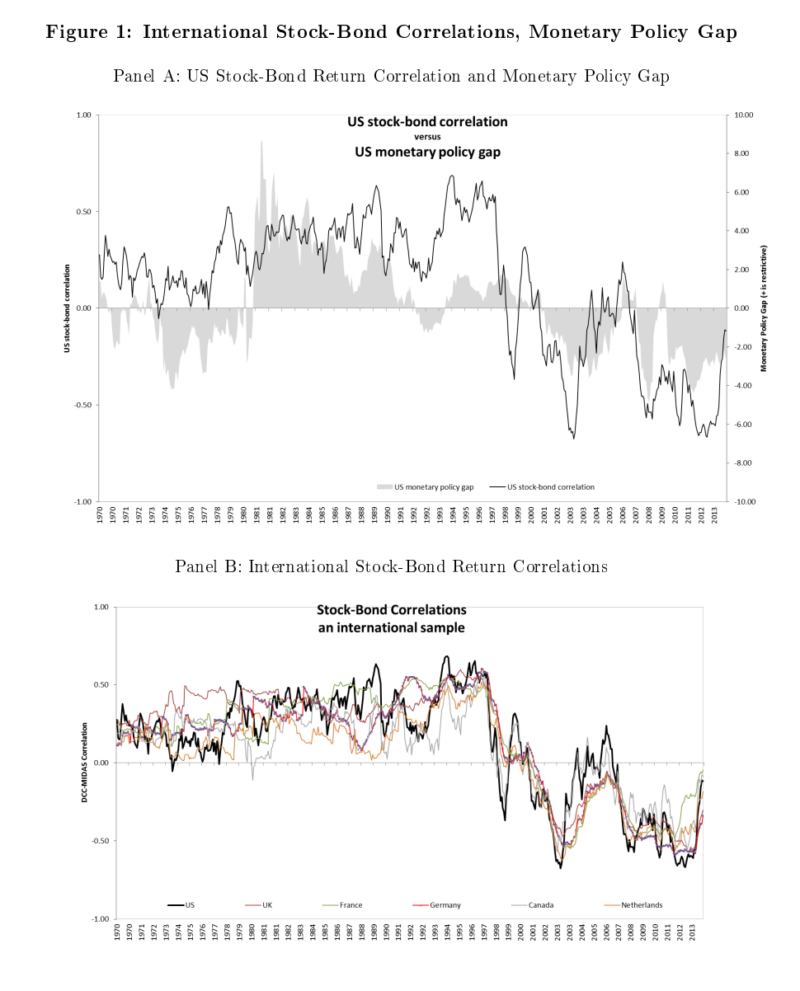
Giving further pause to the idea that Treasuries are a safe haven are the findings of Lieven Baele and Frederiek Van Holle, authors of the 2017 study “Stock-Bond Correlations, Macroeconomic Regimes and Monetary Policy.” They found that while negative stock-bond return correlations tend to occur during flight-to-safety episodes during which increased stock market uncertainty induces investors to flee stocks in favor of bonds, positive correlations tend to occur during periods of stagflation (rising inflation and weakening economic growth). With slowing economic growth, risk aversion pushes up the equity risk premium and rising inflation causes bond yields to rise, leading rising correlations to emerge at exactly the wrong time. This is what happened during the first part of 2022, causing distress for traditional 60/40 portfolios.
Baele and Van Holle also found:
“When inflation is countercyclical, both equities and bonds are risky and move positively with inflation risk, inducing a positive correlation. When instead inflation is procyclical, equity and bond risk premia are negatively correlated as nominal bonds act as a hedge, inducing a negative stock-bond correlation.”
They also noted that prior research had found:
“Supply shocks, either good (positive) or bad (negative), help explain the positive correlations in the 1970s, 1980s, and 1990s, while demand shocks in combination with smaller supply shocks explain some but not all of the negative correlations observed since the year 2000.”
The conclusion is that the hedging benefits of Treasuries are regime dependent and thus are an unreliable hedge against the risk of equities.
Equity Factors
Harvey, Rattray, and Van Hemert examined how factors used in asset pricing models performed during periods of equity drawdowns. They found that quality and profitability strategies constructed in a dollar-neutral way (common in the literature) stand out in terms of their performance during equity drawdowns. This should not be a surprise, as over the period 1964-2021, the correlation of the quality factor to market beta was -0.58 and the correlation of profitability to market beta was -0.2. (1)
They also found that cross-sectional momentum (CSMOM) was “noteworthy for its return during equity drawdowns,” as was the times-series momentum factor (trend). CSMOM’s correlation with market beta was the same as profitability’s at -0.2. While value’s correlation with market beta was -0.24, Harvey, Rattray, and Van Hemert found that it was not as effective a hedge in equity drawdowns as quality, profitability, and CSMOM.
While many would consider the low beta factor a hedge against equity drawdown, it has not been. The reason is that a beta-neutral implementation of the low beta factor requires leveraging up the low beta stocks. While this has tended to lead to better performance in the long term, it has led to worse drawdown-period performance because strategies with embedded leverage underperform when funding constraints tighten. This often occurs at times of market stress (such as during the Great Financial Crisis).
Trend Following (Time-series Momentum)
Trend-following strategies are based on historical evidence demonstrating that an asset’s recent price trend, either positive or negative, tends to persist in the near future. Essentially, trend followers purchase assets that have done well in the recent past and sell/short assets that have done poorly in the recent past. Trend following gives investors tactical market exposure, as the strategy can be long or short an asset class. Trend following is most often implemented using futures contracts.
A large body of evidence, including the 2017 study “A Century of Evidence on Trend-Following Investing” and the 2020 study “Trends Everywhere,” has found that time-series momentum has provided a premium that has been persistent over long periods of time; pervasive across asset classes (including stocks, bonds, commodities, and currencies); robust to various formation periods; is implementable; and has intuitive, behavioral-based explanations for why it persists. For those interested, Andrew Berkin and I presented the evidence in “Your Complete Guide to Factor-Based Investing.”
Harvey, Rattray, and Van Hemert noted that trend following, which sells in market drawdowns and buys in rising markets—mimicking dynamically buying long put options in crashing markets and long call options in rising markets, which would be expensive—is inexpensive because it uses futures contracts, avoiding the cost of options premiums. However, trend following is not as reliable a hedge as buying puts. With that said, they found:
“The performance of trend following was particularly strong in the worst stock and bond market environments, giving credence to the claim that trend following can provide equity and bond crisis alpha.”
They also noted that trend following has a negligible correlation to the quality and profitability factors, resulting in their being complementary hedging strategies.
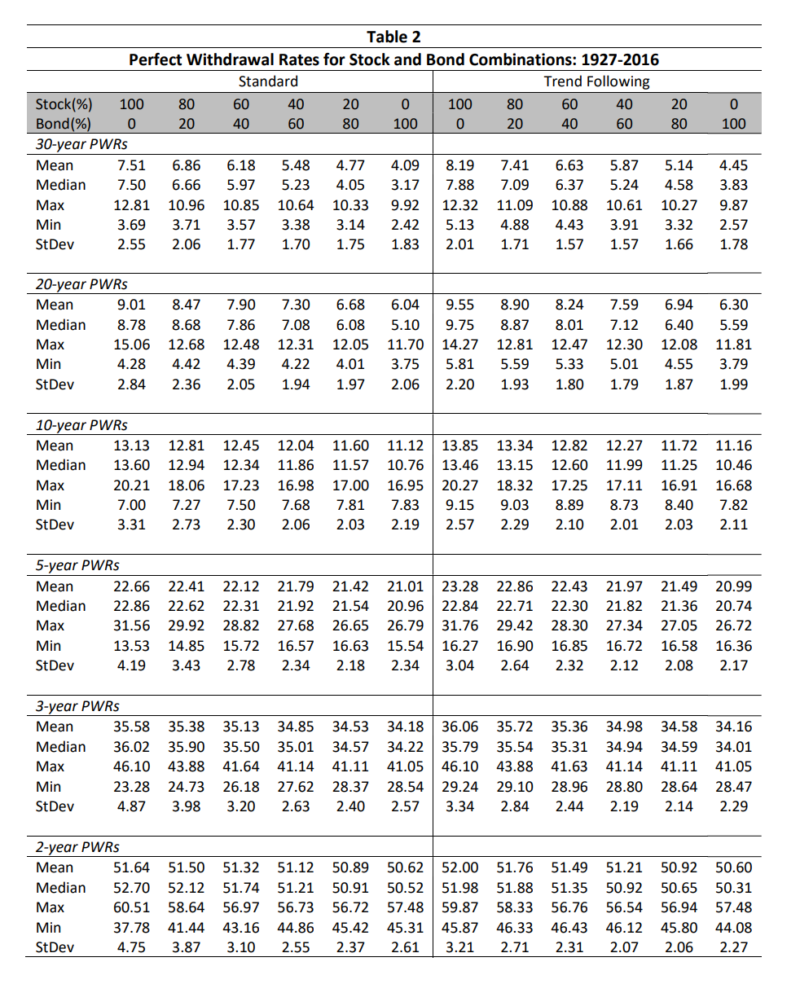
Their findings are consistent with those of the authors of the 2019 study “Absolute Momentum, Sustainable Withdrawal Rates and Glidepath Investing in US Retirement Portfolios From 1925,” who examined the benefits of trend following over the period 1927 through 2016. To test the performance of absolute momentum, they used a simple 10-month trend-following rule. In the case of both stocks and bonds, they were in an uptrend if the price was above the 10-month moving average and thus a long position was held. If the price was below the moving average, the weighted funds were assumed to be invested in T-bills instead. They examined sustainable withdrawals by focusing on perfect withdrawal rates (PWR)—the maximum annual withdrawal rate possible if one had perfect foresight of returns and ran one’s wealth down to zero at the end of the period. They also ran Monte Carlo simulations (MCS) using the same PWR analysis. MCS provides several benefits: 1) It isn’t dependent on a limited history of capital market returns; 2) it allows you to consider a potentially unlimited number of trials, examining results from “alternative universes”; and 3) it allows you to alter capital market assumptions. The following is a summary of the authors’ findings:
- Smoothing the returns on individual assets by simple absolute momentum or trend-following techniques is a potent tool to enhance withdrawal rates. For example, for a 60/40 portfolio with a 30-year horizon, the mean PWR increased from 6.2 percent to 6.6 percent (a relative increase of 6.5 percent), and the minimum PWR increased from 3.6 percent to 4.4 percent (a relative increase of 22.2 percent).
- Applying trend following to bonds had a relatively small impact, with both returns and volatility being slightly lower.
- Trend following greatly reduces the “left tail” of unfortunate withdrawal rate experiences—the bad luck of a poor sequence of returns early in decumulation. This was true for both stocks and bonds. For example, for the traditional 60/40 portfolio, the maximum real drawdown was 49.2 percent but was reduced to 27.3 percent with trend following. For an 80/20 portfolio, the maximum drawdowns were 65.3 percent and 29.5 percent. And for a 20/80 portfolio, the figures were 49.1 percent and 32.2 percent.
Their findings were consistent with those of Andrew Miller, author of the 2017 study “Using Trend-Following Managed Futures to Increase Expected Withdrawal Rates.” Miller examined the period 1926 through 2012. He found that a diversified managed futures strategy, managed to a 10 percent volatility, provided diversification benefits (adding a unique source of risk and return) that historically supported a 0.8 percent higher safe withdrawal rate.
The evidence shows that while trend-following strategies will tend to lag the market over even long periods (creating the risk of tracking variance regret for impatient investors), they tend to perform best just when their benefits are needed most—in severe market downturns. Investors who are looking to protect themselves from severe drawdowns (such as retirees, for whom sequence risk should be of paramount concern) should consider including an allocation to a diversified trend-following strategy, usually in the form of a managed futures fund, as it has historically provided insurance against tail risks.
Volatility Targeting
Harvey, Rattray, and Van Hemert examined whether a strategy designed to counter fluctuations in volatility could reduce tail risk—targeting a constant level of volatility by leveraging the portfolio at times of low volatility and scaling down at times of high volatility. The strategy is based on the findings from academic research.
Financial economists have long known that volatility and returns are negatively correlated. Fischer Black documented that in his 1976 paper, “Studies of Stock Price Volatility Changes.” That relationship results in the tendency to produce negative equity returns in times of high volatility. In addition, the research, including the 2017 study “Tail Risk Mitigation with Managed Volatility Strategies,” demonstrates that past volatility largely predicts future near-term volatility—volatility is persistent (it clusters). High (low) volatility over the recent past tends to be followed by high (low) volatility in the near future. Taken together, these findings have led to the development of strategies that scale volatility inversely to past realized volatility.
The results are hypothetical results and are NOT an indicator of future results and do NOT represent returns that any investor actually attained. Indexes are unmanaged, do not reflect management or trading fees, and one cannot invest directly in an index.
Research, such as the 2017 study “A Century of Evidence on Trend-Following Investing” (summary), the 2018 study “The Impact of Volatility Targeting” (summary), the 2019 studies “Volatility Expectations and Returns” (summary) and “Portfolio Management of Commodity Trading Advisors with Volatility Targeting,” and the 2020 studies “Conditional Volatility Targeting” and “Understanding Volatility-Managed Portfolios” (summary), has not only confirmed that risk assets exhibit a negative relationship between returns and volatility but has also found that in addition to reducing volatility, scaling reduces excess kurtosis (fatter tails than in normal distributions), cutting both tails, right (good tail) and left (bad tail). For portfolios of risk assets, Sharpe ratios (measures of risk-adjusted return) have been higher with volatility scaling. The research has also found that the benefits from volatility targeting are concentrated in high volatility states. In these states, volatility clustering has been stronger and the correlation between realized volatility and future return is significantly more negative. Another key finding was that, since volatility often increases in periods of negative returns, targeting volatility causes positions to be reduced, which is the same direction one would expect from a time-series momentum (trend-following) strategy.
Harvey, Rattray, and Van Hemert found:
“Sharpe ratios are higher with volatility scaling for risk assets (equities and credit) as well as for portfolios that have a substantial allocation to these risk assets, such as a balanced (60-40 equity-bond) portfolio and a risk parity (equity-bond-credit-commodity) portfolio.”
They added:
“Risk assets exhibit a so-called leverage effect (negative relationship between returns and volatility), and so volatility scaling effectively introduces some momentum into strategies. … Historically, such a momentum strategy has performed well and offered protection in down markets.”
Thus, they found that volatility scaling reduced the likelihood of severe drawdowns in equities, balanced stock and bond portfolios, and risk parity portfolios—while also cutting the returns in the right (good) tail. They also noted that volatility scaling had a negligible effect on realized Sharpe ratios for bonds, currencies, and commodities. Investors could have more confidence in volatility scaling in equities if the findings were pervasive.
In summary, Harvey, Rattray, and Van Hemert noted that while the Sharpe ratio is important, most investors have broader objectives, with a particular emphasis on reducing tail risk. The lower probability of very negative returns provided by both trend following and volatility scaling is valuable for most investors. With that said, they emphasized:
“Every crisis is different. For each one, some defensive strategies will turn out to be more helpful than others. Therefore, diversification across a number of promising strategies may be the most prudent.”
Strategic Rebalancing
While most investors rebalance mechanically, they may not realize that mechanical rebalancing can exacerbate drawdowns in extended, severe bear markets as more equity is purchased. Harvey, Rattray, and Van Hemert found that either a direct allocation to trend-following or using trend signals to determine when to rebalance tended to reduce the drawdown materially.
Investor Takeaways
While equities have provided disciplined, long-term investors with a significant risk premium, the premium has not been a free lunch—it’s been accompanied by severe drawdowns. In fact, those drawdowns are the source of the large premium—investors require a large premium in order to take the risks of those large drawdowns. Those risks are exacerbated by sequence risk that faces those in, at or near the withdrawal phase of their investment career. Thus, prudent investors care about more than just returns. They care about managing risks as well, with a particular emphasis on reducing left tail risk in ways that are most cost-effective.
The research shows that the most effective hedges are puts. However, they are too expensive to be used as a long-term, or even tactical, strategy. And while many investors have considered Treasury bonds as safe-havens, reducing left tail risk, they are unreliable hedges, performing poorly during periods when inflation rises above its long-term average. And while gold did provide positive returns in seven of the eight equity drawdowns, providing an annualized return of 9 percent, outside of those eight drawdown periods, gold provided negative returns on average, resulting in a full-period return that was only marginally better than flat.
Fortunately, the research does provide investors with alternative strategies that have on average provided effective hedges for equity crash risk. The most effective of those strategies have been trend following (time-series momentum) and volatility scaling. Rebalancing conditioned on trend signals has also reduced tail risks. There are other alternative strategies that while they don’t hedge equity crash risk, their lack of correlation with equity risks provides diversification benefits that reduce left tail risks while earning significant risk premiums. Among such strategies are reinsurance, drug royalties, life, and structured settlements, and litigation finance. These strategies, all of which are illiquid investments and thus generally cannot be accessed in daily liquid mutual funds or ETFs, can be found in interval funds such as those run by such firms as Stone Ridge Asset Management, Cliffwater, and Variant. Long-short factor funds that can provide exposure to the factors that tend to outperform in equity crashes (such as momentum, quality, profitability, and defensive) also provide diversification benefits along with expected risk premiums.
And finally, in our book “Reducing the Risk of Black Swans,” Kevin Grogan and I showed that historically a portfolio that was highly tilted to small value stocks and used their higher expected returns to lower the overall equity allocation (you don’t need as high an equity allocation because the equities you do hold have higher expected returns), allowing investors to either hold more safe bonds or add other unique sources of risk that don’t correlate highly with either equity or bond risks (such as the ones mentioned above), significantly reduced the risk of equity crashes.
Important Disclosures
For informational and educational purposes only and should not be construed as specific investment, accounting, legal, or tax advice. Certain information is based upon third party data which may become outdated or otherwise superseded without notice. Third party information is deemed to be reliable, but its accuracy and completeness cannot be guaranteed. Mentions of specific securities should not be construed as a recommendation. Alternative investing involves high levels of risk. Individuals should speak with their qualified financial professional based on his or her own circumstances. By clicking on any of the links above, you acknowledge that they are solely for your convenience, and do not necessarily imply any affiliations, sponsorships, endorsements, or representations whatsoever by us regarding third-party websites. We are not responsible for the content, availability, or privacy policies of these sites, and shall not be responsible or liable for any information, opinions, advice, products, or services available on or through them. The opinions expressed by featured authors are their own and may not accurately reflect those of Buckingham Strategic Wealth® or Buckingham Strategic Partners®, collectively Buckingham Wealth Partners. Buckingham Wealth Partners is not affiliated with the above-mentioned fund companies. Neither the Securities and Exchange Commission (SEC) nor any other federal or state agency have approved, determined the accuracy, or confirmed the adequacy of this article. LSR-22-303
References[+]
| ↑1 | Data for Market (Beta), Size, Value, Momentum, and Profitability is based on annual premiums from the Ken French Data Library. Quality is based on monthly data from AQR and compounded to approximate an annual premium. Indices are not available for direct investment. Their performance does not reflect the expenses associated with the management of an actual portfolio nor do indices represent results of actual trading. Information from sources is deemed reliable, but its accuracy cannot be guaranteed. Performance is historical and does not guarantee future results. Total return includes reinvestment of dividends. |
|---|
About the Author: Larry Swedroe
—
Important Disclosures
For informational and educational purposes only and should not be construed as specific investment, accounting, legal, or tax advice. Certain information is deemed to be reliable, but its accuracy and completeness cannot be guaranteed. Third party information may become outdated or otherwise superseded without notice. Neither the Securities and Exchange Commission (SEC) nor any other federal or state agency has approved, determined the accuracy, or confirmed the adequacy of this article.
The views and opinions expressed herein are those of the author and do not necessarily reflect the views of Alpha Architect, its affiliates or its employees. Our full disclosures are available here. Definitions of common statistics used in our analysis are available here (towards the bottom).
Join thousands of other readers and subscribe to our blog.