Since the 1992 publication of “The Cross-Section of Expected Stock Returns” by Eugene Fama and Kenneth French factor-based strategies and products have become an integral part of the global asset management landscape. While “top-down” allocation to factor premiums (such as size, value, momentum, quality, and low volatility) has become mainstream, questions remain about how to efficiently gain exposure to these premiums. Today, many generic factor products, often labeled as “smart beta”, completely disregard the impact of other factors when constructing portfolios with high exposures to any single factor.
However, recent research, such as 2019 study “The Characteristics of Factor Investing” by David Blitz and Milan Vidojevic, has shown that single-factor portfolios, which invest in stocks with high scores on one particular factor, can be suboptimal because they ignore the possibility that these stocks may be unattractive from the perspective of other factors that have demonstrated that they also have higher expected returns.
For example, they found that:
“on average, around 10% of the market portfolio is invested in stocks with dismal model-implied returns and that removing these stocks from the market each month would result in an increase in the realized return of about 16%, in relative terms.”
For individual factors, they found that around 20 percent or more of each portfolio is invested in stocks that have negative implied market-relative returns.
“By removing such stocks, single-factor strategies could be significantly improved. For example, they found that “for the profitability strategy, performance more than triples, from 0.08% to 0.29% per month.”
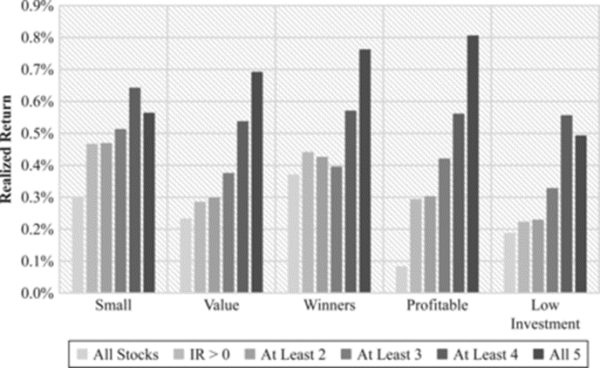
Blitz and Vidojevic also found that performance could be further improved by requiring stocks to have a non-negative exposure to at least one, two, three, or four other, non-targeted premiums (size, value, momentum, profitability, and low volatility)—the greater the requirement, the greater the improvement. For example, a value strategy had a return of 0.23% a month but increased to 0.28% per month if they excluded stocks with negative implied excess returns. If in addition, at the time of portfolio formation, they required that stocks have non-negative exposures to at least two, three, four, and all five-factor premiums, the strategy returns increased to 0.30%, 0.37%, 0.54%, and 0.69%, respectively. However, they noted that as they imposed more constraints, the number of stocks in the portfolio decreased from, on average, 302 with no constraints to 276, 273, 223, 96, and only 13. Thus, there are tradeoffs between expected returns, volatility, and diversification benefits, as well as capacity constraints.
Their findings led Blitz and Vidojevic to conclude that efficient factor investing requires an understanding of how factor characteristics drive portfolio returns.
Emlyn Flint and Rademeyer Vermaak contribute to the factor-based investing literature with their December 2021 study “Factor Information Decay: A Global Study” in which they examined the performance of five well-known factors (value, momentum, quality, investment, and low volatility) across 12 developed and emerging markets over the period January 2002-December 2019. They calculated both target and non-target factor exposure for both pure (factor portfolios which have unit exposure to a single target factor and zero exposure to all other factors within the risk model) and quartile long/short single-factor portfolios per market. They also analyzed how factor exposures decayed over time in order to determine the optimal frequency for rebalancing. For example, momentum is a much higher turnover strategy and thus requires more frequent rebalancing. They used the following factor definitions:
- Value: Price-to-book ratio (Fama and French, 1993)
- Momentum: 12-1month total return (Asness et al., 2013)
- Quality: Return on equity (Asness et al., 2014)
- Investment: Percentage growth in total assets (Fama and French, 2015)
- Low Volatility: 252-day return volatility (Blitz and Van Vliet, 2007)
The table below shows the median factor exposures of long-short quartile portfolios.
Median Factor Exposures of Long-Short Quartile Portfolios
| US Factor | Value | Momentum | Quality | Investment | Low Volatility | Market |
| Value | 2.47 | -0.7 | -1.78 | 0.26 | -0.21 | 0.09 |
| Momentum | -0.73 | 2.5 | 0.29 | -0.13 | 0.58 | 0.14 |
| Quality | -1.74 | 0.29 | 2.46 | 0.48 | 0.41 | -0.20 |
| Investment | 0.36 | -0.18 | -0.56 | 2.31 | -0.02 | -0.04 |
| Low Volatility | -0.26 | 0.43 | 0.36 | 0.04 | 2.47 | -0.58 |
The above table demonstrates that unless an integrated approach is taken, all single-factor portfolios have negative exposure to at least one of the other factors with higher expected returns. For example, value has a large negative exposure to both momentum (-0.73) and quality (-1.78). Thus, a value strategy could be improved through a screening process that would at least eliminate those negative exposures. For example, recognizing the potential benefits, in their value strategies Dimensional has screened negative momentum for almost 20 years (basically eliminating their value funds’ negative exposure to momentum). They also began incorporating profitability (highly correlated with quality) in 2013, Alpha Architect includes this in their quality screening for value.
In terms of decaying exposure, they found that value showed the slowest information decay of all pure factors, with the median still significantly above the half-life threshold after three years. The decay rates of low volatility and quality were slightly faster than for value. On the other hand, they found that factor exposures for investment and momentum decayed at a much faster rate—with median exposures already halving by six months and nearing zero after only 12 months. Thus, the optimal rebalancing period for these factors should be much shorter (increasing turnover and trading costs). Based on these results they concluded:
“The optimal pure factor rebalance periods are 3-4 months for value, 3 months for momentum, 4-5 months for quality, 1 month for investment, and 5-6 months for low volatility. While some of these suggested rebalance periods are in line with prior literature as well as industry practice, others are certainly not. Factor investors should therefore take heed of these results when setting their own rebalance.”
Editor’s note: see this AQR piece for another similar study/perspective.
Investor Takeaways
The evidence makes clear that efficient implementation of factor investing strategies requires an understanding of not only how factors perform independently, but also how they are related to one another. A single-factor approach, where each factor portfolio is constructed in isolation, with a complete disregard for all other factors, is suboptimal. Instead, investors should implement their factor-based strategy using an integrated, multi-factor approach, that considers exposures to all factors while also considering issues related to volatility, diversification, and capacity constraints. Fund families such as Alpha Architect, AQR, Avantis, Bridgeway, and Dimensional use integrated approaches to portfolio construction. So should you.
Important Disclosures:
For informational and educational purposes only and should not be construed as specific investment, accounting, legal, or tax advice. Certain information is based upon third party data and may become outdated or otherwise superseded without notice. Third party information is deemed to be reliable, but its accuracy and completeness cannot be guaranteed. Mentions of specific fund companies are for informational purposes only and should not be construed a specific recommendation of their securities. By clicking on any of the links above, you acknowledge that they are solely for your convenience, and do not necessarily imply any affiliations, sponsorships, endorsements or representations whatsoever by us regarding third-party websites. We are not responsible for the content, availability or privacy policies of these sites, and shall not be responsible or liable for any information, opinions, advice, products or services available on or through them. Neither the Securities and Exchange Commission (SEC) nor any other federal or state agency have approved, determined the accuracy, or confirmed the adequacy of this article. The opinions expressed by featured authors are their own and may not accurately reflect those of the Buckingham Strategic Wealth® or Buckingham Strategic Partners®, collectively Buckingham Wealth Partners.LSR-22-244

About the Author: Larry Swedroe
—
Important Disclosures
For informational and educational purposes only and should not be construed as specific investment, accounting, legal, or tax advice. Certain information is deemed to be reliable, but its accuracy and completeness cannot be guaranteed. Third party information may become outdated or otherwise superseded without notice. Neither the Securities and Exchange Commission (SEC) nor any other federal or state agency has approved, determined the accuracy, or confirmed the adequacy of this article.
The views and opinions expressed herein are those of the author and do not necessarily reflect the views of Alpha Architect, its affiliates or its employees. Our full disclosures are available here. Definitions of common statistics used in our analysis are available here (towards the bottom).
Join thousands of other readers and subscribe to our blog.