Many investors, especially those using a cash flow approach to spending, have long known that they prefer cash dividends. From the perspective of classical financial theory, this behavior is an anomaly. In their 1961 paper, “Dividend Policy, Growth, and the Valuation of Shares,” Merton Miller and Franco Modigliani famously established that dividend policy should be irrelevant to stock returns. As they explained, at least before frictions like trading costs and taxes, investors should be indifferent to $1 in the form of a dividend (causing the stock price to drop by $1) and $1 received by selling shares. This must be true, unless you believe $1 isn’t worth $1. This theorem has not been challenged since, at least in the academic community.
Allaudeen Hameed, Jing Xie, and Yuxiang Zhong, authors of the November 2021 paper “Preference for Dividends and Stock Returns Around the World,” presented evidence that the theory is wrong. They found that controlling for other firm characteristics that explain the cross-section of returns — size, book-to-market, momentum, short-term reversal, market risk, idiosyncratic volatility, and asset growth — over the period 1990-2018, dividend-paying stocks outperformed non-payers by 0.54% per month in 44 countries, adjusting for exposures to global and regional risk factors.
Before you jump to any conclusions, when reviewing findings that don’t agree with economic theory, one should be skeptical about the results because of the degree of freedom the researchers have in selecting the factors to control for. In this case, the authors chose not to include the profitability factor, which is included in the current workhorse asset pricing models (the Fama-French five-factor model that includes beta, size, value, investment, and profitability, the Fama-French six-factor model that adds momentum, and the q-theory model that includes beta, size, investment, and profitability). While it might have been an unintentional decision to exclude profitability, that seems unlikely given that profitability is one of the factors in the leading models, and has been for about a decade. They chose to control for other lesser-utilized factors, such as short-term reversal and idiosyncratic volatility. Perhaps they did consider it, but when the evidence didn’t agree with their hypothesis, they threw out the data instead of their hypothesis. Only the authors know their motivation.
With that skepticism in mind, we can review the performance of U.S. dividend payers versus non-payers from January 1979 – October 2022. In our analysis, we will also examine exposures for the beta, size, value, profitability, investment, and momentum factors in the Fama-French six-factor model. As the table below indicates, the dividend payers had lower exposure to the market beta and size factors while having greater exposure to the other factors. With that said, investors can target exposures to these factors directly without screening for dividends, and would benefit from having a significantly more diversified portfolio (see average number of firms and percent of total market cap covered in the table below).
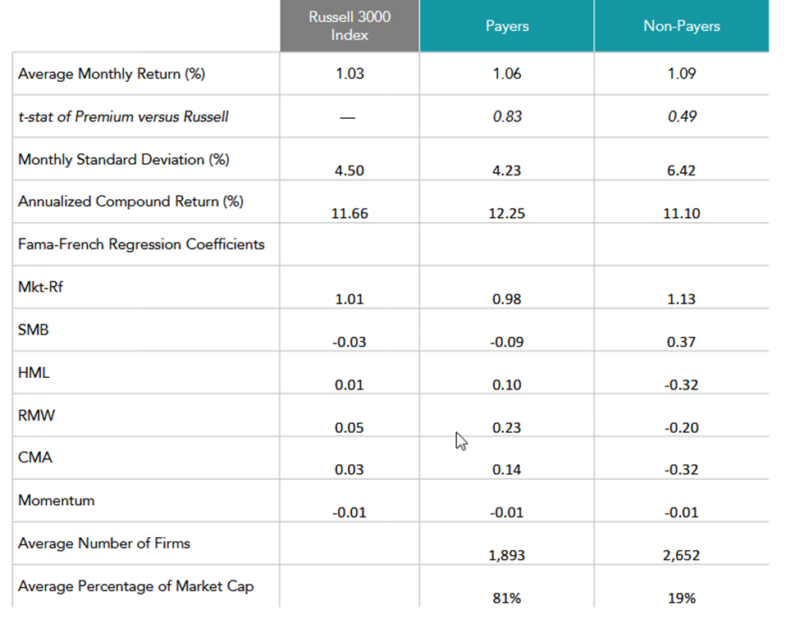
Source: Dimensional, using data obtained from Ken French’s website. Fama/French Five Factor Returns also obtained from Ken French’s website. Firms are classified as non-payers if no dividend was paid in the preceding 12 months. Returns are in USD. SMB, HML, RMW, and CMA are factors for the premiums associated with size, relative price, profitability, and investment, respectively. Frank Russell Company is the source and owner of the trademarks, service marks, and copyrights related to the Russell Indices. The results are hypothetical results and are NOT an indicator of future results and do NOT represent returns that any investor actually attained. Indexes are unmanaged and do not reflect management or trading fees, and one cannot invest directly in an index.
As shown in the table above, without controlling for the factor exposures, while the dividend payers had lower monthly returns (1.06% vs. 1.09%), the significantly higher monthly volatility of the non-payers (6.42% vs. 4.23%) resulted in the dividend payers having a higher annualized compound return (12.25% vs. 11.10%). However, that doesn’t control for the factor exposures.
The following table covers the same January 1979 – October 2022 period but now controls for exposures to various models: the single factor CAPM with beta as the single factor; the Fama-French three-factor model, which adds size and value; the Fama-French five-factor model, which adds profitability and investment; and the Fama-French six-factor model which adds momentum. If the intercept is positive (negative), that shows that after controlling for those factors, the category outperformed (underperformed). A t-stat greater than 2 (3) indicates statistical significance at the 5% (1%) confidence level. The intercepts show monthly returns.
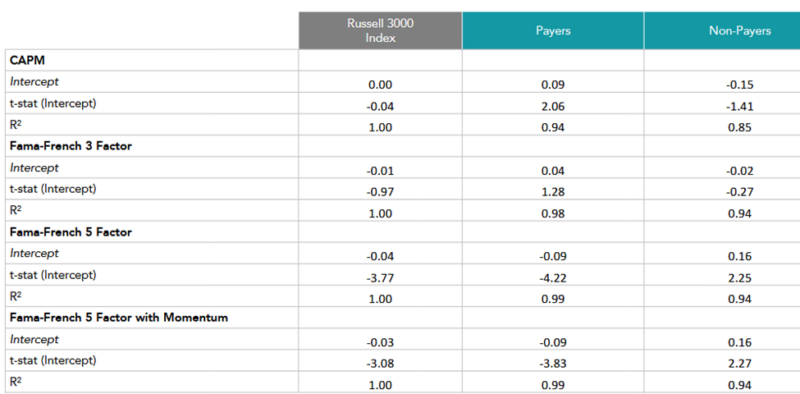
To begin our analysis, note the extremely high r-squareds, indicating that the models explain performance well. Also note that as we added factors, the explanatory power improved, as you would expect. Next, note that if we do not control for profitability (neither the CAPM nor the Fama-French three-factor model control for profitability), the dividend payers generated alpha—though the alpha was only significant against the CAPM, not against the Fama-French three-factor model. However, once we included profitability (along with other factors) the alphas of the dividend payers actually turned negative and with much greater statistical significance. On the other hand, the alphas of the non-payers, while negative relative to the CAPM and Fama-French three-factor models, were positive once we included profitability and the other factors, and were significant at the 5 percent level.
Investor Takeaways
The first takeaway is to be at least skeptical of findings that conflict with economic theory. Be sure to check to see what controls were used, or omitted. The other takeaway should be that even without considering the negative tax implications of dividend-paying stocks (versus a stock that provides all of its returns in the form of capital gains), investors are better served by directly targeting factor exposures in their portfolio rather than using a dividend screen which reduces the investable universe significantly, as only about 40% of stocks pay dividends. Thus, investors screening for dividends exclude about 60% of the eligible universe by number and about 20% of the total market capitalization. All else equal (such as factor exposures), by definition, a less diversified portfolio is less efficient.
PostScript. A note of thanks to Namiko Saito, co-head of research at Dimensional Fund Advisors, for assisting with this article.
Larry Swedroe is head of financial and economic research for Buckingham Wealth Partners.
For informational and educational purposes only and should not be construed as specific investment, accounting, legal, or tax advice. Certain information is based on third party data which may become outdated or otherwise superseded without notice. Third party data is deemed to be reliable, but its accuracy and completeness cannot be guaranteed. Neither the Securities and Exchange Commission (SEC) nor any other federal or state agency have approved, determined the accuracy, or confirmed adequacy of this article. By clicking on any of the links above, you acknowledge that they are solely for your convenience, and do not necessarily imply any affiliations, sponsorships, endorsements or representations whatsoever by us regarding third-party websites. We are not responsible for the content, availability or privacy policies of these sites, and shall not be responsible or liable for any information, opinions, advice, products or services available on or through them. The opinions expressed here are their own and may not accurately reflect those of Buckingham Strategic Wealth® or its affiliates. LSR-22-427
About the Author: Larry Swedroe
—
Important Disclosures
For informational and educational purposes only and should not be construed as specific investment, accounting, legal, or tax advice. Certain information is deemed to be reliable, but its accuracy and completeness cannot be guaranteed. Third party information may become outdated or otherwise superseded without notice. Neither the Securities and Exchange Commission (SEC) nor any other federal or state agency has approved, determined the accuracy, or confirmed the adequacy of this article.
The views and opinions expressed herein are those of the author and do not necessarily reflect the views of Alpha Architect, its affiliates or its employees. Our full disclosures are available here. Definitions of common statistics used in our analysis are available here (towards the bottom).
Join thousands of other readers and subscribe to our blog.