We wrote a couple of times about the valuation spread between the 10% cheapest stocks and the market.(1)
- There was this piece from April 2020 showing that the spread was generally close to where it was in 1999. This was right after a very bad relative drawdown for value stocks, so it made sense value stocks were looking good.
- Then in November 2021, I did an updated piece showing that spreads had, in fact, generally become even wider. They were now beyond 1999 on some measures. I concluded that while this was a large spread, things could always get wider.
Well…things got wider.
Where We Stand Now on the Value Spread
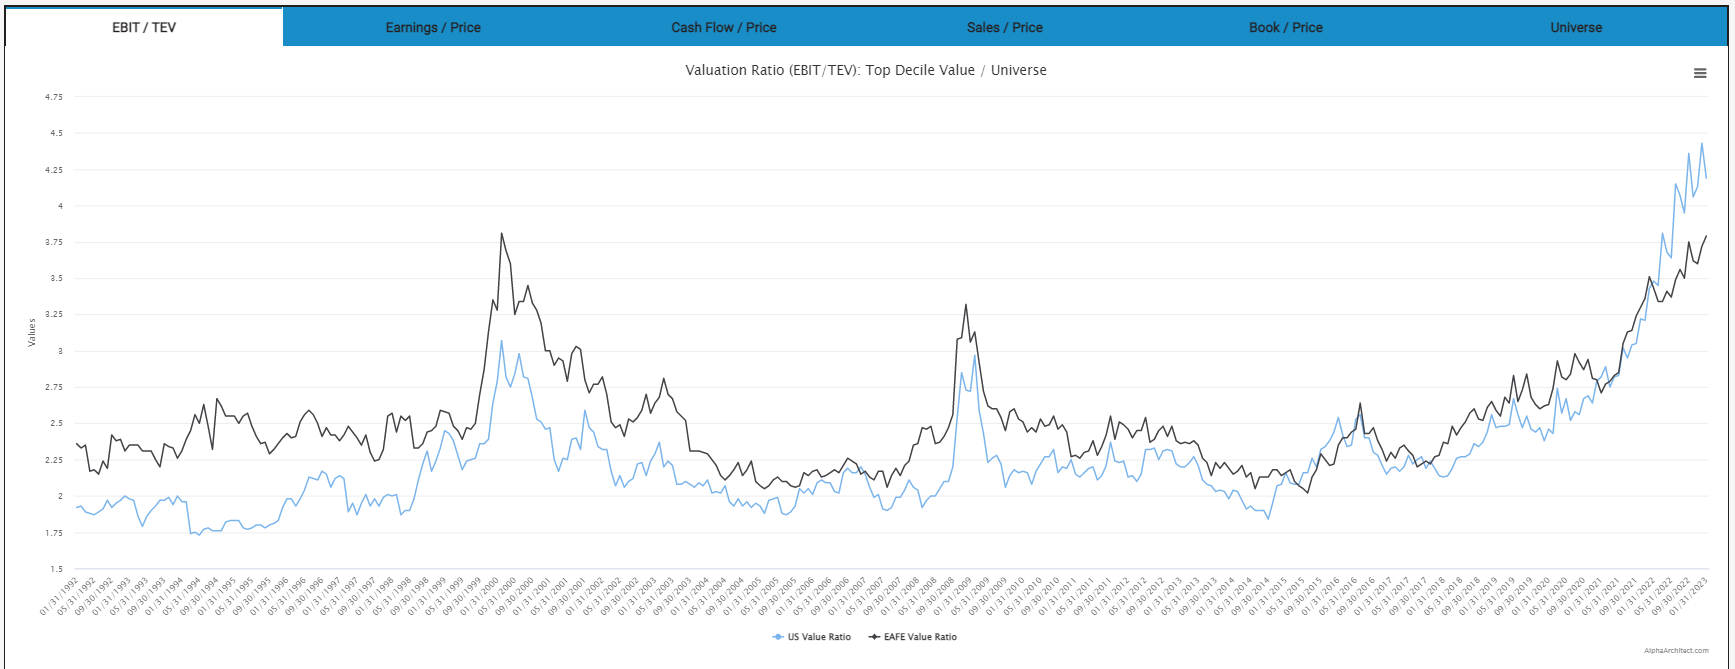
There are three “peaks” in the chart above: The 1999/2000 Tech Bubble, the 2008/2009 Financial Crisis, and today’s situation (We’ll call it “The Covid Bubble”).(2). All of those peaks show when value stocks are historically undervalued relative to the broad market.
The Tech Bubble and the Financial Crisis caused value stocks to become historically cheap. But they got there in different ways.
The Tech Bubble caused value stocks to become undervalued relative to the market simply because tech stocks were going up SO MUCH faster. Investors were buying everything. Value stocks did okay from an absolute return perspective but lagged on a relative return basis. I.e., some tech stocks were up 150%, whereas value stocks were up a measly 15%. You’d be happy if you received a 15% return in a year and didn’t know anything else. But because everyone’s proverbial brother-in-law owned those tech stocks (maybe even with leverage) and was up 400% in the past year, many investors had a serious case of FOMO. It’s wired into human nature for us to care about relative things (as an aside, this is probably why momentum investing works in the first place).
The Financial Crisis caused value stocks to become historically cheap because investors were *selling* everything. It’s said in a true crisis; all correlations go to 1. And that’s generally what happened then. Value stocks (a type of company that has questions about its future) were sold harder than the general market for one reason or another. Good companies were sold beyond what they should have because investors were scared. And this is one of the reasons it’s assumed value investing provided higher returns historically. Investors tend to “throw the baby out with the bath water.”
Today’s peak seems more like the tech bubble than the financial crisis. Expensive stocks were bid up to unfathomably high prices, while deep value type stocks have just plodded along.
Why Should I Care About Value Spreads at Extreme Levels?
Jack wrote a piece showing how value stocks did after the peak of the valuation spreads in 2000 and 2009. To no surprise, they did great. Jack then wrote a piece showing how momentum stocks did after the peak of the valuation spreads in 2000 and 2009. To somewhat of a surprise, they did better than the market but worse than value stocks alone.
If we zoom in on our valuation spread (below), we can see a tiny bit of compression. But we’ve also seen plenty of similar small compressions before.
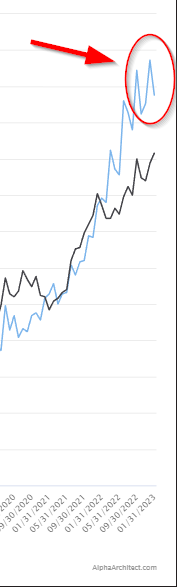
We believe owning deep-value stocks is potentially interesting at these valuation peaks. But as I said in the previous two times I wrote this, the spread can get more extreme. At some point, we’d like to stop talking about the valuation spread and its potential effect on forward expected returns…and see that spread COMPRESS!

References[+]
| ↑1 | The spread is the EBIT yields of the 10% cheapest stocks… |
|---|---|
| ↑2 | I ran a very robust study on what to call this most recent bubble, and Covid Bubble was the most common answer |
About the Author: Ryan Kirlin
—
Important Disclosures
For informational and educational purposes only and should not be construed as specific investment, accounting, legal, or tax advice. Certain information is deemed to be reliable, but its accuracy and completeness cannot be guaranteed. Third party information may become outdated or otherwise superseded without notice. Neither the Securities and Exchange Commission (SEC) nor any other federal or state agency has approved, determined the accuracy, or confirmed the adequacy of this article.
The views and opinions expressed herein are those of the author and do not necessarily reflect the views of Alpha Architect, its affiliates or its employees. Our full disclosures are available here. Definitions of common statistics used in our analysis are available here (towards the bottom).
Join thousands of other readers and subscribe to our blog.