The expense ratio aside, the cost of transacting in an ETF depends on the size of the bid/ask spread at any point in time during the trading day. The ETF investor should make evidence-based trading decisions since the bid/ask spread can range from 1 basis point (bp) to several hundred bps. What are some intelligent guidelines for ETF investors–avoid the open, avoid the close, and what about everything in-between? This article provides data on the effect of the time of day on the average bid/ask spread for ETFs.
Examining Intraday ETF Liquidity: When Should Investors Trade?
- James J. Rowley Jr., Charles J. Thomas, and Ryan E. O’Hanlon
- Journal of Index Investing
- A version of this paper can be found here
- Want to read our summaries of academic finance papers? Check out our Academic Research Insight category.
What are the research questions?
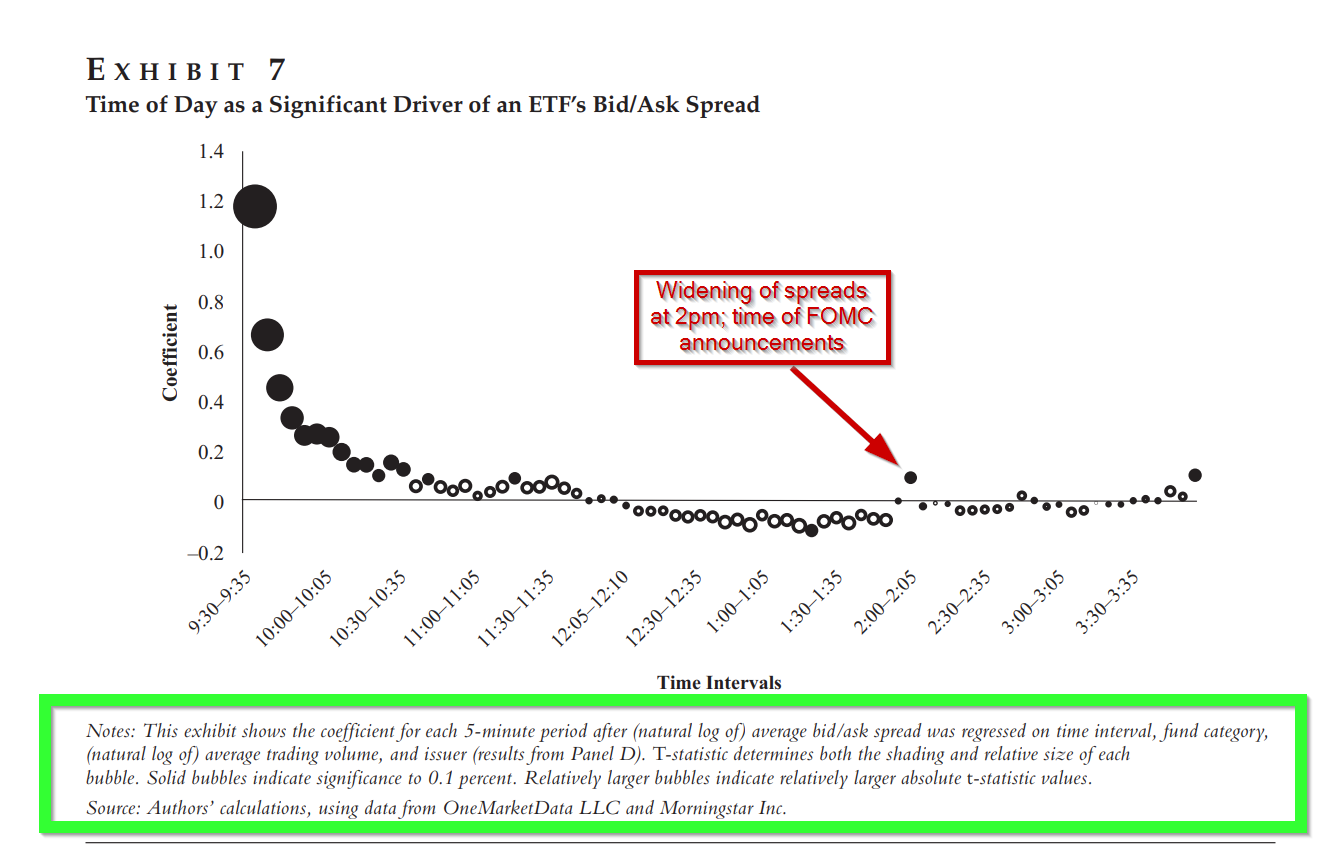
In this study, the trading day was divided into 5-minute intervals (78 total), and the data on ETF bid/ask spreads, trading volume, market cap, and fund issuer (OneMarketData,LLC; Morningstar) for all US domestic equity ETFs, for the year 2017 were analyzed. ETFs without volume data were excluded, as were ETF trades on opening and closing auction days.
- Are there times during the trading day when investors should avoid trading ETFs?
- What about FOMC announcements?
- What drives the ETF bid/ask spread?
What are the Academic Insights?
- YES. The authors report the widest spreads during the first hours after the open and speculate that this provides an opportunity for price discovery surrounding the underlying stocks due to overnight news. This circumstance persists until 10:00 am indicating an end to the price discovery activity. In addition, the conventional wisdom regarding spreads and volume was confirmed. The average bid/ask spread for an ETF was inversely related to trading volume. A univariate regression produced an R-square of 59.1%.
- Spreads are elevated during FOMC announcements after controlling for issuer, fund, and trading volume. Regression results indicated a significant (p=.01) increase in the spread at the 2pm interval. However, that event is accompanied by greater volume, which tends to offset the widening of spreads. The authors argue that FOMC announcements are recurring periods when spreads tend to be elevated. During those event intervals, investors should practice restraint to avoid excess transaction costs.
- TRADING VOLUME. Two sources of trading volume drive the bid/ask spread: 1. The trading volume of the shares of the ETF itself and, 2. The volume of the shares traded of the underlying shares of the ETF. This answer is backed by substantial research that ties high trading volume with smaller spreads. The causal thread goes something like this: if the universe of buyers and sellers of a security or asset is large, this situation by definition, creates greater price discovery. Greater price discovery promotes greater price competition where completing transactions reduces bid/ask spreads. Concerning the underlying securities, the creation/redemption process produces a boundary relative to the underlying transaction costs. That regularity produces a disparity between large and small-cap stocks wherein large caps exhibit tighter spreads than small caps. The mean and variance of spreads both increase as the market cap declines.
Why does it matter?
There are at least 3 guidelines indicated by the research presented in this piece:
- Avoid the open. Spreads are highest in the morning, near the market open.
- Avoid FOMC announcement periods. Spreads are elevated during FOMC announcements.
- Trading at the close is not necessarily a problem, given that increases in trading volume seem to be an offsetting factor.
The most important chart from the paper
The results are hypothetical results and are NOT an indicator of future results and do NOT represent returns that any investor actually attained. Indexes are unmanaged and do not reflect management or trading fees, and one cannot invest directly in an index.
Abstract
In this article, the authors analyze the effect of time of day on the average bid/ask spread of an exchange-traded fund (ETF). They examine a cross-section of 55,781 intraday spread observations generated by 744 US-domiciled ETFs in 2017, controlling for fund category, trading volume, and issuer. The authors find that, both before and after they add controls, average spreads are highest in the early morning, supporting the argument that investors should avoid trading near market open. Before controls, average spreads are tightest in the late afternoon. After controls, they appear elevated during the final five minutes. However, because volume increases substantially during that period, spreads still appear tighter overall. Therefore, our analysis does not support the argument that investors should avoid trading near market close. Unexpectedly, after controls, the authors find higher spreads during Federal Open Market Committee announcements. This suggests that investors should be vigilant when trading at such times.
About the Author: Tommi Johnsen, PhD
—
Important Disclosures
For informational and educational purposes only and should not be construed as specific investment, accounting, legal, or tax advice. Certain information is deemed to be reliable, but its accuracy and completeness cannot be guaranteed. Third party information may become outdated or otherwise superseded without notice. Neither the Securities and Exchange Commission (SEC) nor any other federal or state agency has approved, determined the accuracy, or confirmed the adequacy of this article.
The views and opinions expressed herein are those of the author and do not necessarily reflect the views of Alpha Architect, its affiliates or its employees. Our full disclosures are available here. Definitions of common statistics used in our analysis are available here (towards the bottom).
Join thousands of other readers and subscribe to our blog.