This paper helps investors better understand drawdowns and recoveries, in terms of empirical facts, practical implications, and strategies for handling them. It shows the importance of the “interplay” between drawdowns and recoveries (which the authors call “submergence”), which should not be treated and analyzed separately by investors.
Submergence = Drawdown Plus Recovery
- Rook, Golosovker, Monk
- Working paper, Stanford Long Term Investing
- A version of this paper can be found here
- Want to read our summaries of academic finance papers? Check out our Academic Research Insight category
What are the Research Questions?
The authors analyze the history of drawdowns and recoveries (and their interplay or submergence) to answer the following question:
- What lessons do past drawdowns and recoveries hold for the present and future?
What are the Academic Insights?
Given that a drawdown ends once the trough is reached, at which point a recovery begins and that
the exact transition point between drawdown and recovery is unknown until the recovery finishes, “drawdowns and recoveries mutually define each other.” For this reason the authors propose submergence as a term for describing a drawdown plus subsequent recovery.
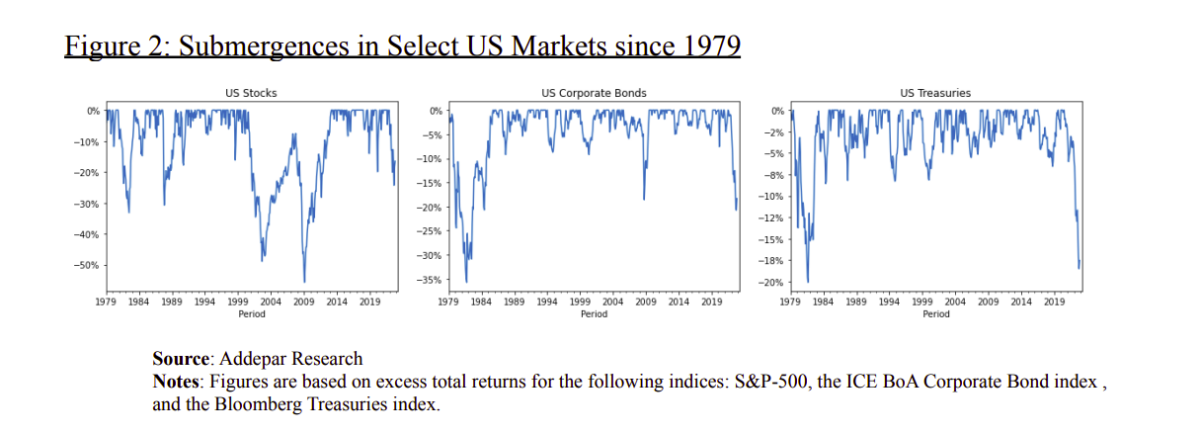
According to research by the authors, stocks and bonds have been submerged for about 75% of the time since 1980; and treasuries have been submerged 80% of the time. Submergences are therefore both commonplace and significant, which means that handling them is very important for investors and their investing strategies.
The results are hypothetical results and are NOT an indicator of future results and do NOT represent returns that any investor actually attained. Indexes are unmanaged and do not reflect management or trading fees, and one cannot invest directly in an index.
The authors find:
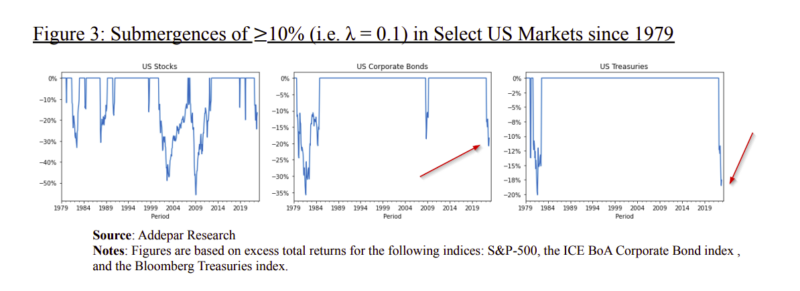
- The present (as of February 2023) submergence is anomalous across markets. By analyzing submergences greater than 10% (see figure below), drawdowns at this level haven’t been encountered in the bond or treasuries markets since the early 1980s, and it’s altogether possible that the present drawdown may go even deeper before a recovery begins. This last finding is based on a positive correlation found between the size and the duration of submergence.
The results are hypothetical results and are NOT an indicator of future results and do NOT represent returns that any investor actually attained. Indexes are unmanaged and do not reflect management or trading fees, and one cannot invest directly in an index.
- Risk-adjusted views of drawdown and recovery episodes can provide a vastly different picture than that which emerges from looking at unadjusted returns alone. However, some of the most popular (volatility-based) methods for risk adjustment may inadequately reflect the particular nature of drawdown risk.
- Smart diversification is a potent weapon against drawdown risk. Yet the style of diversification that’s best suited to handling submergences isn’t necessarily equivalent to that for handling volatility (i.e. diversifying based on unconditional correlations between asset returns). Instead, it is more likely to stem from reducing the overlap in submergence experienced by different assets.
DEFINITIONS:
DRAWDOWN: a declining trend in prices from peak to trough. Hence, a drawdown ends once the trough is reached at which point a recovery begins. The exact transition point between drawdown and recovery is unknown until the recovery finishes, because the trough isn’t identifiable until the peak is once again attained.
SUBMERGENCE: the term for describing a drawdown plus subsequent recovery (due to the fact that an asset or portfolio’s price is submerged beneath its running high for as long as the drawdown and
recovery are taking place)
Additionally, SUBMERGENCE has a number of dimensions:
- Depth: how large is a given submergence, in terms of the size of its drawdown?
- Duration: how long does a submergence last (and how long do its component
drawdown and recovery take, respectively)? - Steepness: how deep is a submergence relative to its duration? Steepness can be
different for drawdown and recovery – i.e., a submergence’s drawdown phase may
be steep (deep but quick) and its recovery not steep (deep but long), or vice versa. - Linearity: how ‘jagged’ is a submergence? Does its drawdown consist mostly of
equally-sized downward movements in price for each period, or does it contain a
mix of up and down moves of unequal size? Likewise, does the recovery proceed
in a straight line, or does it include substantial unevenness in the price path? - Frequency: how often does a submergence with specific properties (such as size
or duration) occur?
Why does this study matter?
Investors tend to focus on drawdowns and not so much on recoveries. This paper introduces a new metric to keep an eye on: submergence. Additionally, the authors offer guidance on what ‘first steps’ investors should take if they’d like to begin better protecting their portfolios against submergence risk.
- Have a clear understanding of their risk preferences and tolerances when it comes to submergence:
- An investor’s choice of this cutoff (λ) influences calculations of submergence density, and thereby submergence-adjusted returns
- κ (kappa): the extent to which an investor is concerned about the maximum depth of submergences, relative to their average depths (which implicitly includes their durations)
- θ (theta): the cutoff for adjusted returns to be positive, relative to the submergence density of a portfolio for the window over which returns are measured
The Most Important Chart from the Paper:
The results are hypothetical results and are NOT an indicator of future results and do NOT represent returns that any investor actually attained. Indexes are unmanaged and do not reflect management or trading fees, and one cannot invest directly in an index.
Abstract
Drawdowns and recoveries are often analyzed separately – yet doing so can leave investors with a distorted view of risk. Indeed, this problem is so commonplace that there’s no consistently-used term for the joint event of a drawdown plus its subsequent recovery. We propose the term ‘submergence’ for such events, and present a new risk metric to help investors analyze them: submergence density. Submergence density overcomes pitfalls of existing metrics, and also allows investors to inject elements of their own risk tolerances, thereby ‘personalizing’ it to their own contexts. Submergence density also offers an alternative method for risk-adjusting returns (with multiple advantages over current methods, such as Sharpe ratios). We use our new risk-adjustment approach to study key markets, and show how it leads to novel diversification strategies. We compare these strategies with other defenses against submergence risk, and conclude that submergence-based diversification is likely the best way for most investors to handle the threat of drawdowns.
About the Author: Elisabetta Basilico, PhD, CFA
—
Important Disclosures
For informational and educational purposes only and should not be construed as specific investment, accounting, legal, or tax advice. Certain information is deemed to be reliable, but its accuracy and completeness cannot be guaranteed. Third party information may become outdated or otherwise superseded without notice. Neither the Securities and Exchange Commission (SEC) nor any other federal or state agency has approved, determined the accuracy, or confirmed the adequacy of this article.
The views and opinions expressed herein are those of the author and do not necessarily reflect the views of Alpha Architect, its affiliates or its employees. Our full disclosures are available here. Definitions of common statistics used in our analysis are available here (towards the bottom).
Join thousands of other readers and subscribe to our blog.