The past decade has witnessed a dramatic increase in spending on intangibles (not just research and development and advertising expenditures, but also expenses related to human capital) relative to tangible capital expenditures on plants and equipment. Given the change, it is not surprising that researchers—including the authors of the 2020 studies “Explaining the Recent Failure of Value Investing,” “Intangible Capital and the Value Factor: Has Your Value Definition Just Expired?,” and “Equity Investing in the Age of Intangibles,” the 2021 study “Value of Internally Generated Intangible Capital,” and the 2023 study “Intangibles as a Quality Attribute”—have focused on the impact on equity valuations and returns resulting from the change in the relative importance of intangible assets compared to physical assets.
The authors of each of the aforementioned studies found that the increasing importance of intangibles, at least for industries with high concentrations of intangible assets, is playing an important role in the cross-section of returns and thus should be addressed in portfolio construction. Not accounting for intangibles affects not just value metrics but other measures (such as profitability) that often scale by book value or total assets, both of which are affected by intangibles—and investors recognize at least some of their value.
Latest Research
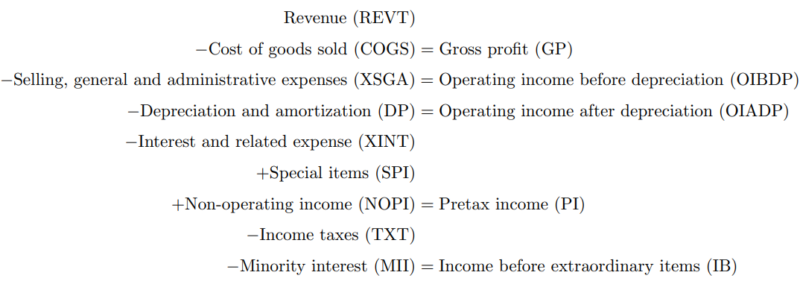
Ravi Jagannathan, Robert Korajczyk, and Kai Wang contribute to the asset pricing literature with their April 2023 study “An Intangibles-Adjusted Profitability Factor,” in which they proposed a modification of the Fama-French profitability factor, which takes into account the fact that profitability, based on U.S. generally accepted accounting principles (GAAP), includes currently expensed costs that should rightly be considered investments in intangible assets, such as research and development (R&D) and portions of selling, general, and administrative (SG&A) expenses—GAAP profitability reflects investments in physical capital by capitalizing and depreciating those expenditures over time while immediately expensing R&D and SG&A expenditures.
To measure earnings in their profitability factor, Fama and French subtract the SG&A expenses and interest expenses from gross profit. To assess the ability of various earnings measures to predict future cash flows (years t+1 through t+ 10) Jagannathan, Korajczyk, and Wang regressed future cash flows (measured by the Compustat Cash Flow from Operations) on current earnings metrics. Of the measures that do not adjust for intangibles, they used (moving from bottom-line to top-line measures) net income, earnings before extraordinary items, earnings before taxes (EBT), earnings before interest, taxes, depreciation, and amortization (EBITDA), gross profit, and revenue.
Their data sample covered the period 1988-2021. They excluded firms with negative book equity and removed firms with total assets less than $25 million or book equity less than $12.5 million in year t to avoid the influence of small firms. Their cross-sectional regressions were for 50 portfolios sorted by five industry groups and the Fama-French measure of profitability (annual revenues minus cost of goods sold, interest expense, and SG&A expenses divided by book equity for the last fiscal year end). Their focus was on three alternative measures of intangibles investment: one that adds to earnings R&D expenses only; one that adds to earnings R&D expenses and 30% of SG&A; and one that adds to earnings R&D expenses and 100% of SG&A.
In their regressions they used eight asset pricing models, including the Fama-French five-factor model (market, size, value, investment, and profitability); the Fama-French six-factor model (adding momentum); the q-factor model (market, size, investment, and profitability) and an augmented q-factor model that adds an expected growth factor; and the mispricing model (includes market, size, and two mispricing factors) of Stambaugh and Yuan. Following is a summary of their key findings:
- “The EBITDA measure of Fama and French had a higher average r-squared for predicting future cash flows relative to gross profitability for all horizons, and the differences were significant at horizons of one through nine years.” (Note that the Fama-French measure of operating profits—revenue minus cost of goods sold minus SG&A minus interest costs—is not the same as EBITDA.)
- R&D expense relative to sales and book equity of all firms was stable over the sample period but exhibited heterogeneity across industries, with the high tech and health industries being the most R&D intensive and experiencing rapid growth.
- The intangible-adjusted profitability factor had positive alpha against the original Fama-French five-factor profitability factor alone and the full Fama-French five-factor model.
- When intangibles adjustments were included, the measure had less predictive power in predicting cash flows (measured by r-squared) than the Fama-French EBITDA measure at horizons of one to two years, but greater predictive value at horizons of three to 10 years, with horizons of five to 10 being significantly higher. This makes intuitive sense since R&D expenditures may take some time to impact cash flows.
- The model that includes R&D plus 30% of SG&A had lower predictive power than the model that only considers R&D at horizons of one year through four years and higher predictive value for longer horizons (significant for years eight through 10).
- The model that included 100% of SG&A had lower predictive power than the model that included 30% at all horizons.
- The largest average return spreads and t-statistics were for the three intangibles-adjusted measures.
- Substituting the original Fama-French profitability factor with the intangibles-adjusted profitability factor led to a model that effectively subsumed some of the well-known asset pricing anomalies, such as momentum, operating leverage, and monthly-rebalanced return on equity. (Note that their test is a univariate regression in which various anomalies are regressed on the profitability factor—RMW, robust minus weak—or intangibles-adjusted RMW. Unfortunately, they did not show the results that control for other factors. In addition, as shown in Table 10, the r-squared of the momentum factor was only 5% and there was large alpha.) For the R&D model and the R&D plus 30% of SG&A model, the alphas were positive and the largest across all profitability measures and statistically significant across all eight benchmark models. Adding these factors to the benchmark factors significantly increased the Sharpe ratios of the portfolio space spanned by the factors with t-stats ranging from 2.26 to 7.25—the intangibles-adjusted profitability measures added explanatory power for the cross-section of assets beyond that captured by the eight models studied.
- While including 30% of SG&A improved the explanatory power of the intangibles-adjusted factors, adding 100% of SG&A always reduced both the magnitude of the estimated alphas and the t-stats. Testing fractions of 0% to 100% of SG&A at increments of 10%, the highest levels of alpha were generally for adding a fraction of 20%.
- While all of the profitability factors had non-trivial downside risk and the intangibles-adjusted profitability factors had the smallest realized downside risk, all the profitability factors had higher returns when the excess return on the market was negative than when it was positive.
- The significant intangibles-adjusted factor alphas were not solely coming from the short side.
- The performance of intangibles-adjusted profitability factors was not solely a post-2000 phenomenon.
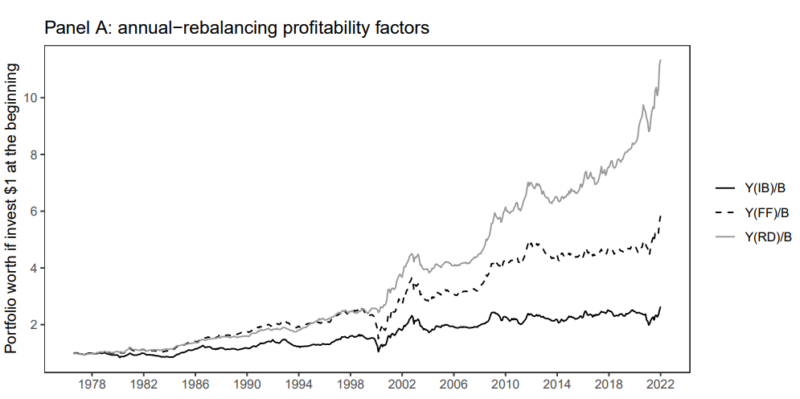
Note: Y(IB)/B is income before extraordinary items over book equity; Y(FF)/B is Fama-French operating profits over book equity; and Y(RD)/B adjusts income for R&D.
The results are hypothetical results and are NOT an indicator of future results and do NOT represent returns that any investor actually attained. Indexes are unmanaged and do not reflect management or trading fees, and one cannot invest directly in an index.
Their findings led Jagannathan, Korajczyk, and Wang to conclude that their empirical results provided support for the ability of the Fama-French earnings measure to predict future cash flows while also providing support for the increased predictive power at longer horizons when using intangibles-adjusted profitability. They added that while R&D expense plays a crucial role in strengthening the relationship between profitability measure and expected returns, a fraction of SG&A expense is also important.
Houston, We Have a Problem!
While Jagannathan, Korajczyk, and Wang adjusted the income portion of profitability for intangibles (including SG&A), they failed to make the same adjustment for book value (“We define annual total book equity as Compustat data item CEQ and quarterly book equity.”). Thus, they used inconsistent accounting treatment (creating an apples-to-oranges comparison). To be consistent, when adding back intangible adjustments to income (the numerator), one should also increase the book value (the denominator)—adding back R&D and part of SG&A implies that one is now capitalizing these costs, resulting in an increase in the balance sheet, which requires an adjustment to the book value. Consider technology firms that typically have high R&D expenditures. Thus, when adjusting profitability (the numerator) for intangibles, technology firms will have higher profitability. However, adjusting the book value for the intangibles will also result in raising the denominator. Consequently, the profitability with adjustments to both the numerator and denominator may or may not be greater than the unadjusted profitability, resulting in a lower alpha than if you don’t adjust the book value. Unfortunately, the authors failed to either make that adjustment, or they failed to report their findings because the alphas they found when adjusting only the numerator would have disappeared—they would not have a finding to report and no paper to publish. Unfortunately, we don’t know what their results would have been if they had made the proper adjustment.
With that in mind, we will review the results of the 2021 study “Internally Developed Intangibles and Expected Stock Returns,” which did make the adjustments to both profitability and book value.
Conflicting Findings
The authors, Savina Rizova and Namiko Saito of Dimensional Fund Advisors, estimated the value of internally developed intangibles systematically across global markets over time by accumulating the historical spending on R&D (to capture the development of knowledge capital) and SG&A (to capture the development of organization capital) and amortizing them at fixed rates. While they too found that adding estimated internally developed intangibles would have had a slightly positive impact on the value premium over the long term and would have mitigated (but not eliminated) its underperformance in recent years, they also found that this impact was primarily driven by differences in sector weights—adjusting for sector differences largely eliminated premium differences. They also found that the profitability premium with intangibles adjustments to both the denominator and the numerator was similar to the unadjusted one. Their findings led them to conclude: “Our research does not find compelling evidence that we should include estimates of internally developed intangibles in company fundamentals such as book equity. The estimation of internally developed intangibles contains a lot of noise. Perhaps due to this high level of noise, we find that estimated internally developed intangibles provide little additional information about future firm cash flows beyond what is contained in current cash flows.” The result was that adjusting for internally generated intangibles did not improve upon the use of a combination of traditional value metrics plus sorting for profitability. I spoke with the AQR research team and learned that their conclusions are broadly consistent with those of Dimensional.
Interestingly, Rizova and Saito also found that “while the ratios of estimated internally developed intangibles to assets vary across sectors, they have been stable over time for each sector.” Their findings are why Dimensional’s value strategies do not attempt to adjust for internally generated intangibles. Instead, they use the traditional price-to-book (high minus low, HML) metric but also sort for profitability.
Investor Takeaway
Intangible assets, which have become increasingly important to the economy, are not reflected in book values, and therefore popular value metrics, such as the book-to-market (B/M) ratio, may be “mismeasured.” Academics and fund managers have been trying to address the valuation issues related to intangibles not being on the balance sheet through various methods. One method is to use alternatives to price-to-book (P/B) as the value metric, such as price-to-earnings (P/E), price-to-cash flow (P/CF), and enterprise value-to-earnings before interest, taxes, depreciation, and amortization (EV/EBITDA). Many fund families (such as Alpha Architect, AQR, BlackRock, Bridgeway, and Research Affiliates) use multiple value metrics (such as P/E, P/CF, P/S, and EBITDA/EV), some of which indirectly provide exposure to the profitability factor. Another alternative is to add other factors to the definition of the eligible universe. For example, since 2013 Dimensional has included a sort for profitability in their value funds. A third alternative is to add back to book value an estimate of the value of intangible R&D and organization expenses. Another way to address the issue is to apply what some call “contextual” stock selection, using different metrics or different weightings of those metrics depending on the intangible intensity. For example, if book value is not well specified for industries with high intangibles, it may be less effective in those industries than in industries with low intangibles.
For most practitioners, the exclusive use of the traditional HML factor to build a value portfolio is no longer standard practice. Stay tuned, as we are likely to see more research on this important subject.
Larry Swedroe is head of financial and economic research for Buckingham Wealth Partners.
For informational and educational purposes only and should not be construed as specific investment, accounting, legal, or tax advice. Certain information is based on third party data and may become outdated or otherwise superseded without notice. Third party information is deemed to be reliable, but its accuracy and completeness cannot be guaranteed. Mentions of specific fund families should not be construed as a recommendation of the fund families or their respective securities offered. By clicking on any of the links above, you acknowledge that they are solely for your convenience, and do not necessarily imply any affiliations, sponsorships, endorsements or representations whatsoever by us regarding third-party websites. We are not responsible for the content, availability or privacy policies of these sites, and shall not be responsible or liable for any information, opinions, advice, products or services available on or through them. Neither the Securities and Exchange Commission (SEC) nor any other federal or state agency have approved, determined the accuracy, or confirmed the adequacy of this article. LSR-23-487
About the Author: Larry Swedroe
—
Important Disclosures
For informational and educational purposes only and should not be construed as specific investment, accounting, legal, or tax advice. Certain information is deemed to be reliable, but its accuracy and completeness cannot be guaranteed. Third party information may become outdated or otherwise superseded without notice. Neither the Securities and Exchange Commission (SEC) nor any other federal or state agency has approved, determined the accuracy, or confirmed the adequacy of this article.
The views and opinions expressed herein are those of the author and do not necessarily reflect the views of Alpha Architect, its affiliates or its employees. Our full disclosures are available here. Definitions of common statistics used in our analysis are available here (towards the bottom).
Join thousands of other readers and subscribe to our blog.