Momentum crashes are a blight on the performance of momentum strategies. Although there has been a fair amount of research on the topic, few practical solutions have emerged to mitigate the impact on portfolios. In this study, the authors document the outperformance of momentum stocks, made somewhat “immune” to momentum crashes , by including stocks far away from their peak position relative to stocks very near their peaks. Turns out the outperformance is very large. It also accounts for the majority of negative momentum performance.
Momentum Crashes and the 52-Week High
- Suk-Joon Byun & Byounghyun Jeon
- Financial Analysts Journal
- A version of this paper can be found here
- Want to read our summaries of academic finance papers? Check out our Academic Research Insight category.
What are the research questions?
- Why do stocks far from their peaks outperform stocks near their peaks, contemporaneous with market rebounds?
- Can the use of a measure of the “nearness” or “farness” from peak momentum for a stock mitigate the impact of momentum crashes without affecting the level of profitability in a momentum strategy?
The variables were constructed and analyzed using data from CRSP, Compustat, Datastream and a few other providers. Momentum is calculated as the cumulative 12 month return from t-12 to t-1, end of month. The “Nearhigh” variable is calculated as the ratio of the price at month t-1 to the high closing price during the last 12 months, bounded by zero and 1.
The sample includes every common stock on the NYSE, AMEX, and NASDAQ subject to data availability and liquidity requirements. The time period analyzed was January 1930 to March 2022.
Market rebounds are defined as months where the contemporaneous market return is positive and the recent 1-year return is negative. There are 157 of 1107 months identified as market rebounds over the observation period.
What are the Academic Insights?
- The authors point to a surge in investor sentiment as the driver of this outperformance. When the market rebounds, an increase in investor behavior and consequently an increase in demand for stocks that appear far from their peak performance. As a result, and in the context of a market rebound, stocks very far from their peak levels outperform stocks very close to their peaks. The authors report that stocks far away from their peak return exhibit a significant increase in speculative trading. Approximately 17% more trading follows at least a one standard deviation decrease in a stock’s nearness to its 52-week high. Consistent with that result, most of those trades appear to be buyer-initiated suggesting that the 52-week “losers” benefit from speculative buying behavior during the rebound. And to top it all off:
- “The outperformance of stocks far from their peaks over stocks near their peaks reverses in the long run. The cumulative return of a long–short strategy based on nearness to 52-week highs is no longer negative one year after the portfolio formation and onward. This is consistent with long-term correction of overpricing in stocks far from their 52-week highs.”
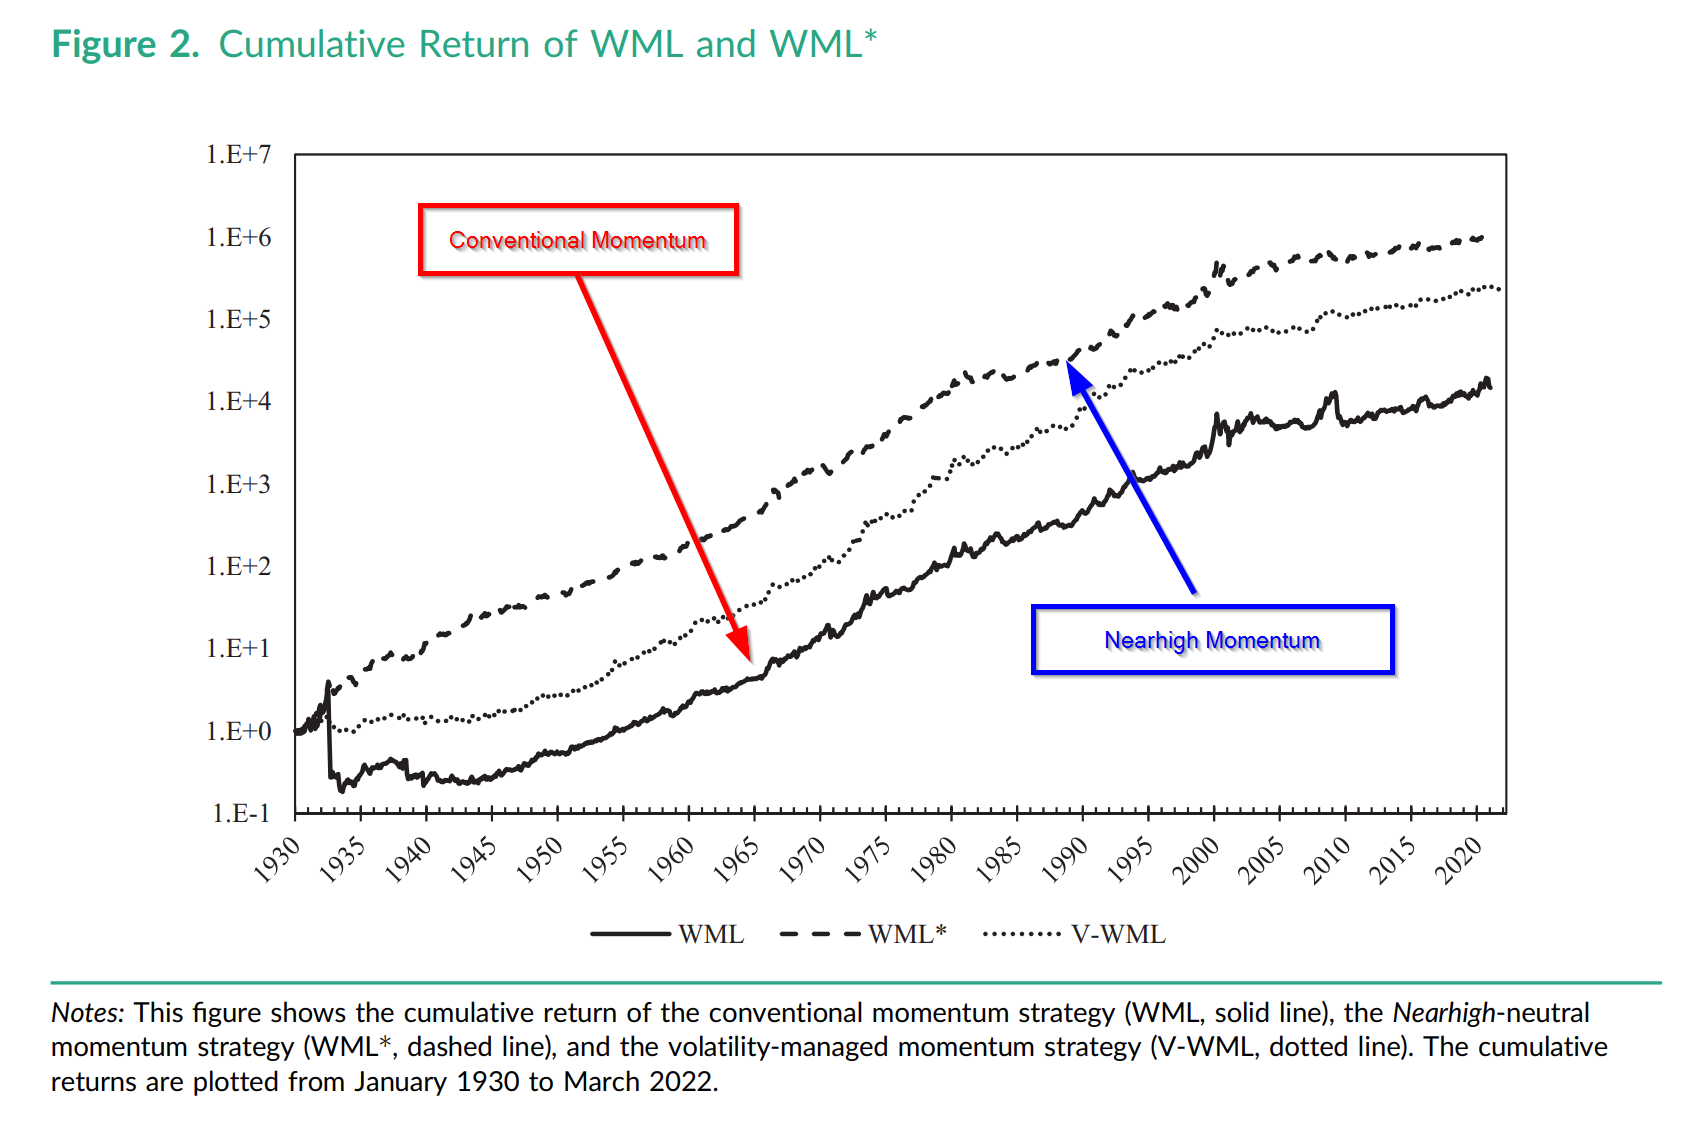
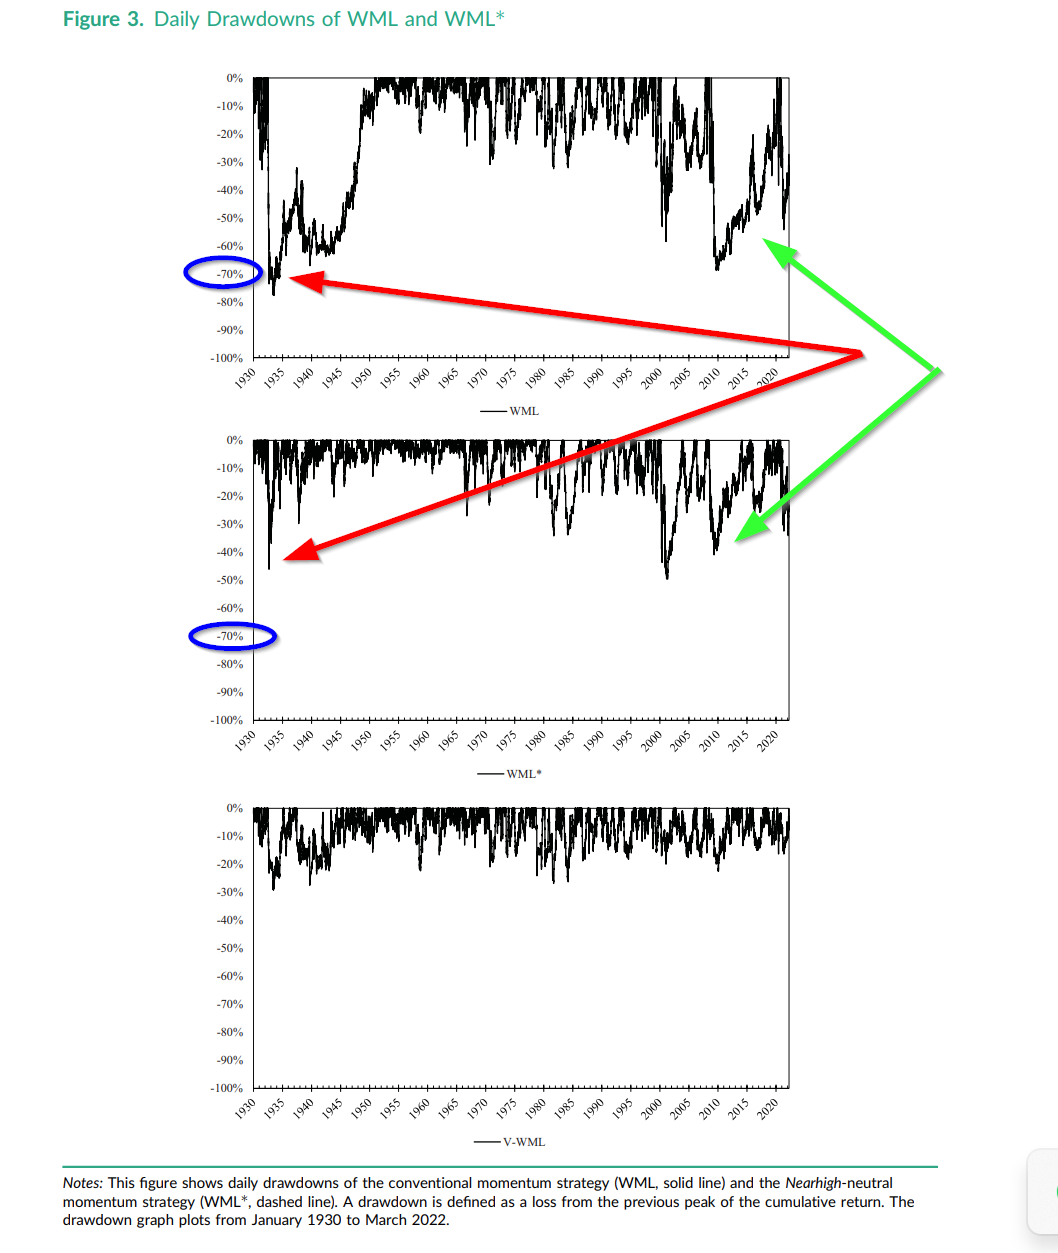
- YES. The daily drawdowns for a typical momentum strategy and a Nearhigh momentum are presented in Figure 3 below. Note that at either end of the figure, the drawdown for the Nearhigh strategy is approximately 40% vs. 70% for the conventional strategy. And the picture for profitability? See Figure 2 below.
Why does it matter?
From the point of view of contribution to the literature on momentum crashes, this research offers at least three contributions:
- This study is the first to document the significant role the measure of “nearness/farness” to 52-week highs in explaining momentum crashes;
- The near/far relationship to momentum crashes is explained via an investor sentiment channel;
- The relationship between the nearness to 52-week high and the last 12-month return series is key to developing the crash free momentum while maintaining a similar level of profitability.
The most important chart from the paper
The results are hypothetical results and are NOT an indicator of future results and do NOT represent returns that any investor actually attained. Indexes are unmanaged and do not reflect management or trading fees, and one cannot invest directly in an index.
Abstract
Momentum strategies suffer from occasional large drawdowns referred to as momentum crashes when the market rebounds. We find that a surge of investor speculation toward stocks far from their 52-week highs can partially explain the momentum crashes. If a momentum strategy is revised to be neutral on a 52-week high effect, momentum crashes are significantly attenuated and the revised strategy does not exhibit procyclical returns. Furthermore, the revised strategy generates a higher Sharpe ratio in different sub-periods and international stock markets.
About the Author: Tommi Johnsen, PhD
—
Important Disclosures
For informational and educational purposes only and should not be construed as specific investment, accounting, legal, or tax advice. Certain information is deemed to be reliable, but its accuracy and completeness cannot be guaranteed. Third party information may become outdated or otherwise superseded without notice. Neither the Securities and Exchange Commission (SEC) nor any other federal or state agency has approved, determined the accuracy, or confirmed the adequacy of this article.
The views and opinions expressed herein are those of the author and do not necessarily reflect the views of Alpha Architect, its affiliates or its employees. Our full disclosures are available here. Definitions of common statistics used in our analysis are available here (towards the bottom).
Join thousands of other readers and subscribe to our blog.