My August 4, 2022, Alpha Architect article examined the research demonstrating that cross-sectional momentum has provided a premium that has been found to be persistent across time and economic regimes, pervasive around the globe and across sectors and asset classes (stocks, bonds, commodities and currencies), robust to various definitions, and survives transactions costs. And within equities, compared to the market, value, size, profitability and quality factors, it has delivered the highest premium. Equity momentum has also had the worst crashes, making the strategy unappealing to investors with strong risk aversion. The research also has found that large gains of previous losers drove the crashes in the momentum factors. At the same time, winners still exhibited modestly positive returns. That finding led to research that showed that crashes were at least partially forecastable, and thus some strategies could significantly reduce the risk of momentum crashes.
For example, Pedro Barroso and Pedro Santa-Clara’s 2015 study, “Momentum has its Moments,” found that the risk of momentum was highly variable over time and was predictable by its own realized variance and that there was a negative relationship between momentum volatility and subsequent returns – momentum volatility increased in times of momentum crashes. The management of that risk virtually eliminated crashes and nearly doubled the Sharpe ratio of the momentum strategy. Thus, they proposed a strategy of constant volatility targeting (specifically, 12%) to address the issue.
Kent Daniel and Tobias Moskowitz’s study, “Momentum Crashes,” published in the November 2016 issue of the Journal of Financial Economics, found that they could improve upon Barroso and Santa-Clara’s constant volatility strategy, building a dynamic momentum strategy that scaled exposure based on forecasts of momentum’s mean and variance. They found: “An implementable dynamic momentum strategy based on forecasts of momentum’s mean and variance approximately doubles the alpha and Sharpe ratio of a static momentum strategy and is not explained by other factors. These results are robust across multiple periods, international equity markets, and other asset classes.”
Other studies, including the 2017 study “A Century of Evidence on Trend-Following Investing,” the 2018 study “The Impact of Volatility Targeting,” and the 2019 study “Portfolio Management of Commodity Trading Advisors With Volatility Targeting,” have also found that momentum strategies have benefited from scaling volatility.
In addition, the 2020 study “Conditional Volatility Targeting” authors found that scaling strategies could be improved by adjusting risk exposures conditional on (extreme) volatility states. Their strategy reduced risk exposures during high volatility states, increased risk exposures during low volatility states, and maintained an unscaled exposure otherwise. They found that the conditional strategy significantly reduced drawdowns and tail risks across all major equity markets and momentum factors and significantly reduced turnover. Their findings were consistent with those of Georg Cejnek and Florian Mair, authors of the 2020 study “Understanding Volatility-Managed Portfolios, who found that while a simple linear regression showed no clear relationship between outperformance and volatility, once volatility exceeded a certain threshold, the volatility-managed portfolio always outperformed the unmanaged strategy.
New insights
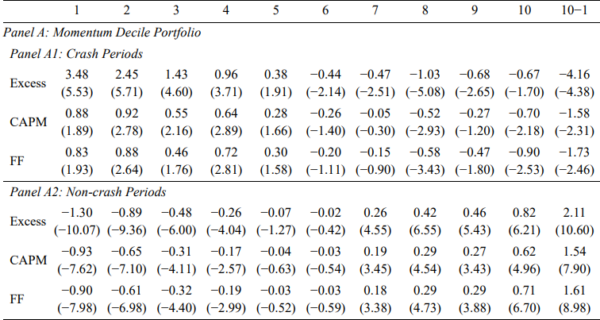
Suk-Joon Byun and Byounghyun Jeon, authors of the study “Momentum Crashes and the 52-Week High,” published in the April 2023 issue of the Financial Analysts Journal, investigated whether the nearness to a stock’s 52-week high could explain momentum crashes and thus provide insights into how to minimize momentum’s crash risk. The two main variables in their study were past 12-month returns (momentum) and nearness to a 52-week high (“near-high”). They defined the momentum of stock i at the end of month t as its cumulative returns from t − 11 to month t − 1. Near-high is the ratio of the price at the end of month t to the highest closing price during the past 12 months, with near-high ranging from zero to one. Their sample included every common stock listed on the NYSE, AMEX, and Nasdaq, excluding those with prices below $5, covering 1926-December 2015. They defined market crashes as periods when the contemporaneous market return (CRSP 1-10) was positive and the past one-year cumulative market was negative. Their definition recognized 149 of 1,062 months (14%) as the crash periods and matched all the 10 largest cross-sectional momentum crash incidents. Following is a summary of their key findings:
- During the crash periods, the monthly return monotonically decreased from the bottom loser decile (3.48%) to the top winner decile (−0.67%) – the traditional momentum strategy that longs the winners and shorts the losers earned −4.16% per month when the market rebounded. Outside the crash periods, the traditional momentum strategy earned a significantly positive profit of 2.11%.
The results are hypothetical results and are NOT an indicator of future results and do NOT represent returns that any investor actually attained. Indexes are unmanaged and do not reflect management or trading fees, and one cannot invest directly in an index.
- The near-high portfolio produced much larger cross-sectional variation in returns compared to traditional momentum – during the crash periods, the monthly return monotonically decreased from the bottom to top decile from 5.01% to −2.11%, a return spread of −7.12%. This suggests that near-high stocks were the dominant drivers of momentum crashes.

The results are hypothetical results and are NOT an indicator of future results and do NOT represent returns that any investor actually attained. Indexes are unmanaged and do not reflect management or trading fees, and one cannot invest directly in an index.
- In a bivariate portfolio sort, momentum losers no longer outperformed momentum winners when their nearness to the 52-week highs were set to be similar. For example, within the bottom 20% of stocks far from their 52-week highs, both winners and losers earned a similar excess return (in excess of market) of 4.1% and 4.7%, respectively.
- Stocks far from peaks outperformed stocks near peaks by more than 3.4 percentage points per month in each momentum quintile, and momentum crashes were attributable to such outperformance.
- Market rebounds triggered an increase in investor sentiment and an inflow of speculative buying demands. For example, a one-standard-deviation decrease in nearness to the 52-week highs resulted in 24.74% more small trading compared to the previous 12-month average. Since speculators are prone to anchoring bias, these demands concentrated on stocks far from peaks, which resulted in their price run-up, contributing substantially to general time variation and fat-tailed distribution of unconditional momentum profits.
- The near-high-neutral momentum strategy was free of crashes and exhibited normal-like distribution – skewness was closer to zero, kurtosis was smaller, and minimum return attenuated. Specifically, minimum return increased from −69.3% to −26.87% and skewness from −1.73 to 0.48.
- After neutralizing the effect of nearness to the 52-week high, the average return increased from 1.23% to 1.49% and the standard deviation decreased from 7.40% to 5.08%, generating a 50% increase in the Sharpe ratio.
- The near-high-neutral momentum strategy earned stable profits and did not exhibit pro-cyclicality. Following up and down market, the strategy earned similar returns of 1.50% and 1.46%, respectively, while the conventional momentum strategy earned 1.57% and 0.30%. In addition, the past market return, past market volatility, past market illiquidity, and proxies for the business cycle did not predict profits of the near-high-neutral momentum strategy, as opposed to the conventional momentum strategy.
- The results were robust to the most extreme crash months and the alternative specification of sample stocks, sample periods, market rebound, momentum measure, and nearness to price peaks and findings in Japan (where the strategy revived a momentum premium), the United Kingdom and continental Europe.
Their findings led the authors to conclude: “Stocks far from peaks outperforming stocks near peaks during the market rebounds are the key to understanding the economic channel behind momentum crashes and momentum profits’ time-variation.” They added: “Our results provide useful insight on momentum itself, and makes its profitability even more puzzling.”
Investor takeaways
The empirical research demonstrates that, on average, investing in previous winners and short selling previous losers offers highly significant returns that other common risk factors cannot explain. However, momentum also displays huge tail risk, as there are short but persistent periods of highly negative returns. Crashes occur particularly in reversals from bear markets when the momentum portfolio displays a negative market beta and momentum volatility is high.
Fortunately, the empirical evidence has found that crashes are at least partially predictable and that the predictability and thus the performance of momentum strategies can be improved by employing systematic strategies.
Larry Swedroe is head of financial and economic research for Buckingham Wealth Partners. For informational and educational purposes only and should not be construed as specific investment, accounting, legal, or tax advice. Certain information is based on third party data and may become outdated or otherwise superseded without notice. Third party information is deemed to be reliable, but its accuracy and completeness cannot be guaranteed. The securities mentioned should not be construed as a recommendation. By clicking on any of the links above, you acknowledge that they are solely for your convenience, and do not necessarily imply any affiliations, sponsorships, endorsements or representations whatsoever by us regarding third-party websites. We are not responsible for the content, availability or privacy policies of these sites, and shall not be responsible or liable for any information, opinions, advice, products or services available on or through them. The opinions expressed here are their own and may not accurately reflect those of Buckingham Strategic Wealth or its affiliates. LSR-23-516
About the Author: Larry Swedroe
—
Important Disclosures
For informational and educational purposes only and should not be construed as specific investment, accounting, legal, or tax advice. Certain information is deemed to be reliable, but its accuracy and completeness cannot be guaranteed. Third party information may become outdated or otherwise superseded without notice. Neither the Securities and Exchange Commission (SEC) nor any other federal or state agency has approved, determined the accuracy, or confirmed the adequacy of this article.
The views and opinions expressed herein are those of the author and do not necessarily reflect the views of Alpha Architect, its affiliates or its employees. Our full disclosures are available here. Definitions of common statistics used in our analysis are available here (towards the bottom).
Join thousands of other readers and subscribe to our blog.