The focus of this research is on the impact, if any, industrial pollution has on expected returns. It may be that firms can reduce costs in the short run by ignoring environmental abatement activity. Or, returns may suffer in the long run as any one or more of the “negative externalities” such as negative publicity, activist protests, litigation, reputation risk, regulatory penalties, and so on, begin to have an impact. “Prior finance research shows that consumption and production influence expected stock returns. Little is known, however, about the role of their by-product—industrial pollution—in asset pricing.” Hence, the major research question examined here is: What is the impact of industrial pollution on market pricing?
The Pollution Premium
- Po-Hsuan Hsu, Kai Li, and Chi-Yang Tsou
- Journal of Finance
- A version of this paper can be found here
- Want to read our summaries of academic finance papers? Check out our Academic Research Insight category.
What are the research questions?
- Is there a significant relationship in the cross-sectional variation between equity returns and industrial pollution?
- If yes, what is the underlying mechanism?
What are the Academic Insights?
- YES. An average annual excess return of 4.42% was obtained from a long/short strategy where a long position was taken in high emission intensity firms versus a short position in low emission intensity firms. The excess return remained economically and statistically significant when well accepted risk or other control factors were included in the analysis. The L/S portfolio strategy was supplemented with an analysis of the cumulative abnormal returns (CARs) associated with a major national event. In this case, the event was the 2016 US presidential election. A monotonic relationship across quintiles ranked by emission intensity was reported. The highest intensity portfolio produced a CAR of 6.31% and 3.64% for the lowest intensity portfolio across the 10-day window around the election. The authors conclude the results support the notion that markets do in fact attend to environmental policies as well as the magnitude of emissions at the firm level.
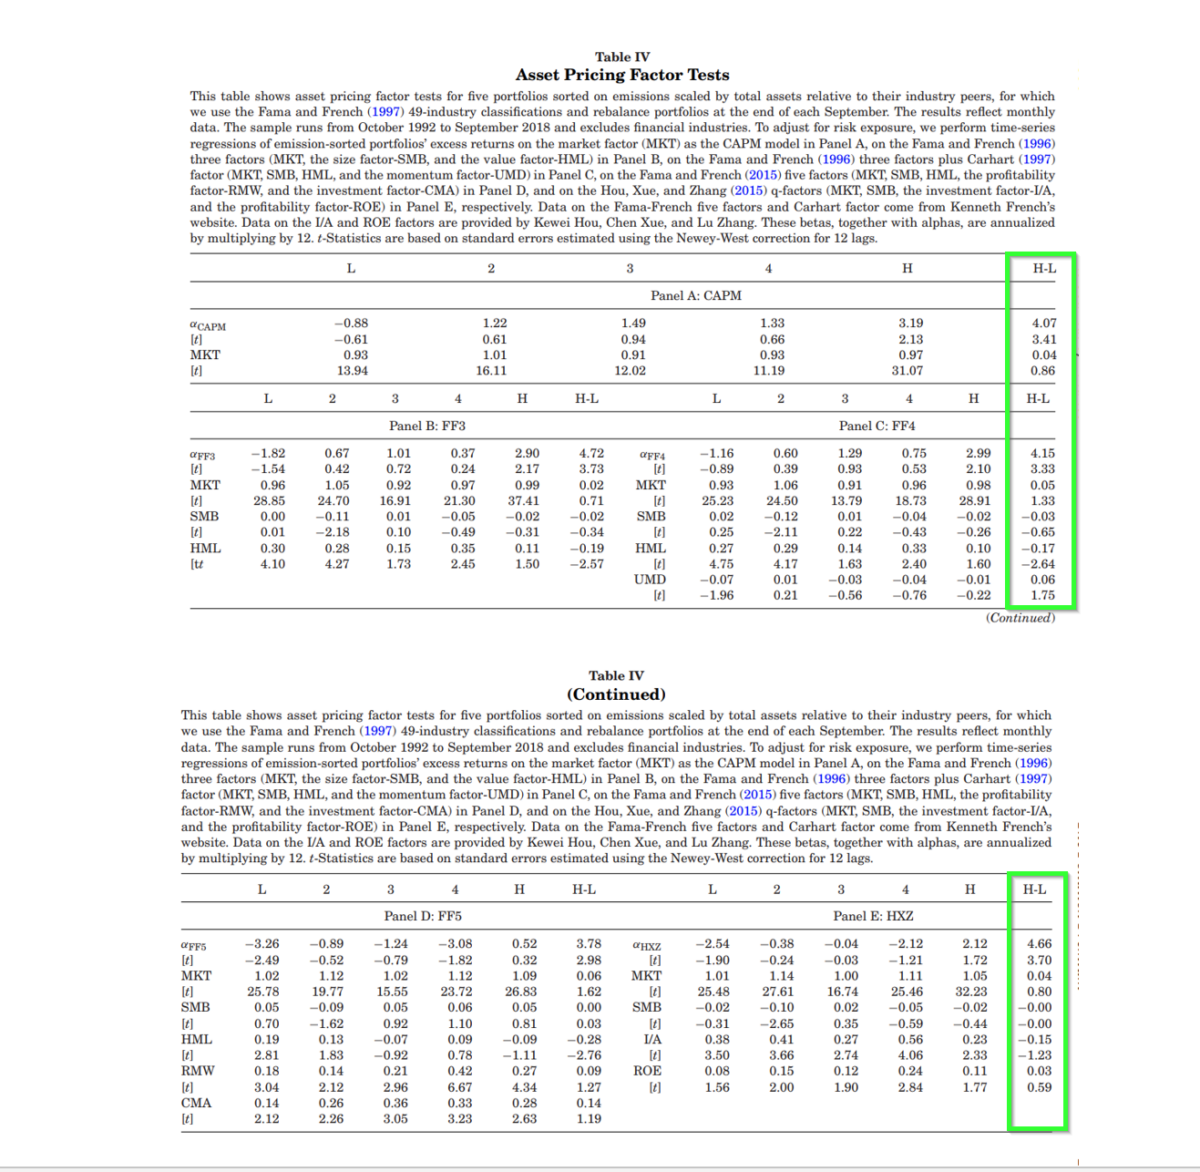
- The long/short return spread associated with toxic emissions was analyzed and was found to be robust to various risk factors including the CAPM and the Fama-French risk models (See Table IV below), corporate governance variables, political associations, investor behavior, and firm characteristics. In the context of those results, the authors propose a new risk factor associated with the uncertainty of environmental policies and regulations.
- The emissions intensity variable is calculated using data from the Toxic Release Inventory gathered and maintained by the EPA. Specifically, the amount of various chemical emissions from all plants is summed for each firm and divided by total assets obtained from Compustat. The exposure to a change in environmental policy (regime shift) was found to be negatively priced, Firms with a higher exposure to the emissions intensity factor were expected to and did produce higher returns. The firms with the highest emissions scores were also associated with higher profits and with the incidence of involvement in environmental lawsuits.
Why does it matter?
This paper adds to the growing literature that analyzes the policy implications of environmental pollution. The authors have developed and tested a new factor unexplained by current risk models and reflects the sensitivity to a regime shift in environmental policy for an individual firm. Given the fairly long observation period (1991-2016) it seems reasonable that the measure may contribute to improving the credibility of ESG scores.
The most important chart from the paper
The results are hypothetical results and are NOT an indicator of future results and do NOT represent returns that any investor actually attained. Indexes are unmanaged and do not reflect management or trading fees, and one cannot invest directly in an index.
Abstract
This paper studies the asset pricing implications of industrial pollution. A long-short portfolio constructed from firms with high versus low toxic emission intensity within an industry generates an average annual return of 4.42%, which remains significant after controlling for risk factors. This pollution premium cannot be explained by existing systematic risks, investor preferences, market sentiment, political connections, or corporate governance. We propose and model a new systematic risk related to environmental policy uncertainty. We use the growth in environmental litigation penalties to measure regime change risk and find that it helps price the cross section of emission portfolios’ returns.
About the Author: Tommi Johnsen, PhD
—
Important Disclosures
For informational and educational purposes only and should not be construed as specific investment, accounting, legal, or tax advice. Certain information is deemed to be reliable, but its accuracy and completeness cannot be guaranteed. Third party information may become outdated or otherwise superseded without notice. Neither the Securities and Exchange Commission (SEC) nor any other federal or state agency has approved, determined the accuracy, or confirmed the adequacy of this article.
The views and opinions expressed herein are those of the author and do not necessarily reflect the views of Alpha Architect, its affiliates or its employees. Our full disclosures are available here. Definitions of common statistics used in our analysis are available here (towards the bottom).
Join thousands of other readers and subscribe to our blog.