New research reveals that the performance of the hedge fund industry has not been as bad as the results from studies that relied on hedge fund data providers.
Hedge funds play an important role in financial markets, promoting price efficiency and liquidity to less liquid markets. Their limited regulatory constraints, their ability to restrict investor capital, and their ability to take short positions, and use leverage and derivates helps them to act as arbitrageurs.
Daniel Barth, Juha Joenväärä, Mikko Kauppila, and Russ Wermers, authors of the October 2023 study “A Bias-Free Assessment of the Hedge Fund Industry: A New Evaluation of Total Assets, Alphas, and the Flow-Performance Relation,” combined data from six leading commercial hedge fund vendor databases with confidential regulatory filings (from SEC Form PF, which was established by the SEC and the Commodity Futures Trading Commission in 2011 to fulfill a mandate in the Dodd-Frank Wall Street Reform and Consumer Protection Act of 2010 to collect data that supports monitoring large private funds).
Their data covered all hedge funds with at least one U.S. investor and spanned the period 2013-2019. This is important because hedge fund data vendors collect information on a purely voluntary basis, and many of the largest hedge funds choose not to list in any vendor database. The voluntary nature of reporting to a hedge fund data vendor induces a potential self-selection bias due to: attrition bias that results from poorly performing funds exiting the vendor data; backfill bias arising from funds reporting backdated (generally good) performance upon first listing; and incubation bias resulting from investment advisors listing only the few funds (of potentially many) that have an encouraging track record. Controls included fund size, strategy, investor redemption restrictions, fees, indicators for leverage and offshore domicile, and lagged performance. Following is a summary of their key findings:
- The number of funds reporting to vendor databases (including those that reported on Form PF) decreased each year, from a high of 10,348 in March 2013 to 8,103 in December 2019. Conversely, the number of funds reporting to only Form PF increased each year from 2013 to 2019.
- The industry is much larger than prior estimates. By 2019 it was managing $6.0 trillion in worldwide net assets, 67% larger than the largest vendor estimate.
- At the end of 2019, funds constituting 52.9% of the industry’s total net assets under management (AUM) did not report to any of the six vendor databases, explaining the underestimates of the size of the industry by commercial database vendors.
- Aggregate gross AUM, roughly equal to equity capital plus borrowing, exceeded $11.3 trillion.
- The average leverage for both vendor-listed funds and non-listed funds was 1.9.
- Defining highly liquid funds as those for which all investors are contractually permitted to redeem their capital within at least seven days, including lockups, notice periods, and redemption frequencies; and highly illiquid funds, defined as those for which the most restricted investors are unable to redeem capital within one year or longer:
- Over 28% of vendor-listed funds were highly liquid, while 16% were highly illiquid. For non-listed funds, only around 15% of funds had highly liquid shares, whereas over 40% were classified as having highly illiquid shares.
- Aggregate hedge fund net assets grew by 52% over 2013-19. However, vendor-listed net assets grew by 30%, while non-listed net assets grew by 79%.
- The mean market beta for vendor-listed funds was 0.50 with a standard deviation of 0.59. For non-listed funds, the mean market beta was lower, at 0.37, with a standard deviation of 0.50. Betas on the other factors were comparably similar. Across all factors, non-listed funds demonstrated tighter exposures to systematic risks—the tails of the distributions for vendor-listed funds were fatter.
- The median management and performance fees in vendor-listed funds were 1.50% and 20.00%, respectively, and for non-listed funds 0.96% and 19.04%, respectively.
- Funds that reported only via regulatory filings exhibited better risk-adjusted performance (“alpha”), stronger performance persistence, and a lower sensitivity of investor flows to past returns relative to those reporting to vendor databases.
- Using a global 7 (G7) factor model, vendor-listed (non-listed) funds earned a monthly gross of fee mean return of -0.063% (0.41%) and a median return of -0.032% (0.21%).
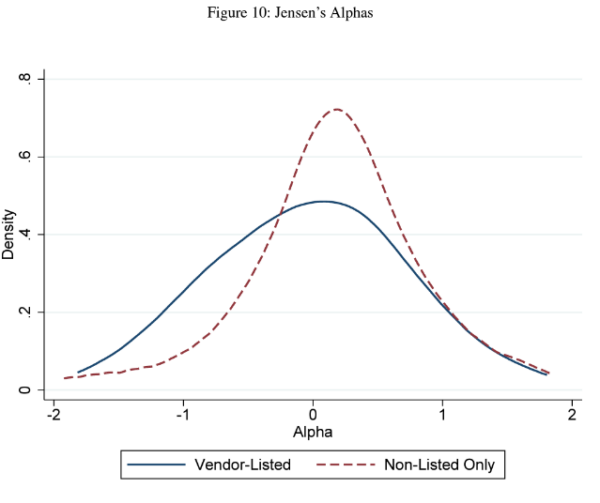
- Similar differences were found using net-of-fee returns, with non-vendor funds producing net alphas. Net-of-fee alphas from the G7 model were 35 basis points per month greater on average for non-listed funds.
- The total return to the AUM-weighted portfolio of non-listed funds was 63% over the period 2013-2019 versus just 20% for the vendor-listed funds. Similar differences were found within almost all strategy types. Over the same period, one-month Treasury bills returned a total of 5%, five-year Treasurys returned 15%, and the CRSP 1-10 (total market index) returned 156%.
- While vendor-listed funds generated a negative value of $200 billion from 2013 through 2019, non-listed funds added $600 billion of value.
- One dollar invested in the AUM-weighted portfolio of vendor-listed equity-style funds would have been worth $1.34 by December 2019 versus $1.78 if invested in non-vendor funds—a cumulative performance difference of 44 percentage points. Similar outperformance of the non-listed funds was found in relative value strategies (16% total return vs. 53%), credit strategies (10% vs. 45%), event-driven strategies (31% vs. 103%), multi-strategy (11% vs. 50%), managed futures (8% vs. 19%), and other strategies (13% vs. 66%). The only strategy for which the non-listed funds did not outperform the vendor-listed funds was macrostrategy (16% total return for vendor-listed funds vs. 8% for non-listed funds).
- Highly liquid funds earned significantly lower alphas on average, whereas highly illiquid funds earned significantly larger alphas (more on this in the Takeaway section).
- There was no evidence that the degree of the percentage of the fund owned by fund managers was materially related to returns for non-listed funds.
- None of the controls were able to explain the difference in risk-adjusted returns between listed and non-listed funds.
- Funds that listed with a data vendor showed limited persistence over short horizons and no persistence over medium or long horizons. On the other hand, non-listed funds displayed strong persistence, with economically large and highly significant coefficients, throughout almost all estimation and prediction horizons. These results remained when accounting for return smoothing that may artificially inflate return persistence.
- Despite the worse performance, investor flows into vendor-listed funds were substantially higher, 87% stronger than for non-listed funds.
- The mean quarterly flow for vendor-listed funds was 3.78% but -0.10% for non-listed funds.
- One explanation for the better performance but lower flows of non-listed funds was that these funds maintained a gross-of-fee efficient size by returning capital to investors (or refusing further capital injections)—aggregate flows for non-listed funds were negative in most quarters.
Their findings led Barth, Joenväärä, Kauppila, and Wermers to conclude: “Our results suggest that non-vendor-listed hedge funds have less fragile capital and higher alphas than publicly-marketed funds.” They added that contrary to the conventional wisdom, “self-selection into listing with a data vendor biases estimates of aggregate hedge fund performance downward.” They explained:
“Our results are consistent with hedge fund manager skill associating with the decision to list with commercial hedge fund data services. Our evidence suggests that hedge fund managers with uncertain or difficult-to-forecast skills list in vendor databases to garner attention from investors and raise capital. Because skill is scarce, managers in the vendor data produce zero alpha on average and demonstrate little performance persistence. Further, investor flows to these funds are highly sensitive to performance, as investors appear to rely strongly on past returns to update their beliefs about managers’ diffuse abilities. Conversely, our results are consistent with managers with more certain and established skills having a greater ability to raise capital without reporting to data vendors, as there is less uncertainty around their skills, and the relationship between performance and flows is, therefore, smaller as a result. Thus, while we show that the hedge fund industry is substantially larger than previously estimated, the ‘unreported’ capital is more permanent and earns significantly higher alphas.”
They added one other important observation: “Our results also suggest that due to stickier capital, non-listed funds may face fewer limits for arbitrage.”
Investor Takeaways
Barth, Joenväärä, Kauppila, and Wermers confirmed prior research findings that hedge funds with results available on data vendors have been, in aggregate, poor investments, producing negative alphas and thus subtracting hundreds of billions of value from investor portfolios. However, the authors also provided hope for investors in hedge funds by finding that non-listed hedge funds were able to add value and that there was persistence in their performance (helped by limiting their assets under management). However, before jumping to that conclusion, consider the following.
First, as Table 1 below shows, while the mean returns to the non-listed funds outperformed in aggregate (0.55% per month vs. 0.35% per month), at the 50th percentile the returns were close to identical (0.40% per month vs. 0.36%); and at the 75th percentile, the listed funds outperformed by a large margin (2.17% per month vs. 1.70% per month). Thus, most of the outperformance of the non-listed funds was a result of the superior performance of a relatively small percentage of the non-listed funds.
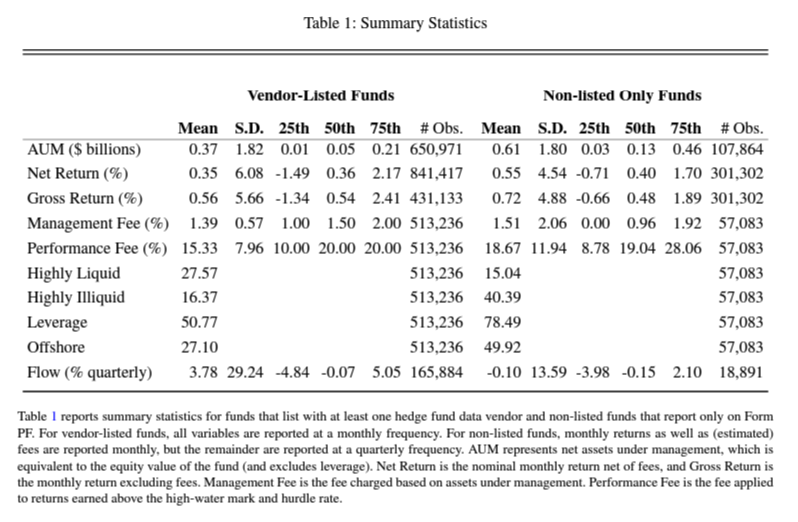
The results are hypothetical results and are NOT an indicator of future results and do NOT represent returns that any investor actually attained. Indexes are unmanaged and do not reflect management or trading fees, and one cannot invest directly in an index.
Second, as shown in Table 6 below, even at the 40th percentile non-listed funds produced negative alphas.
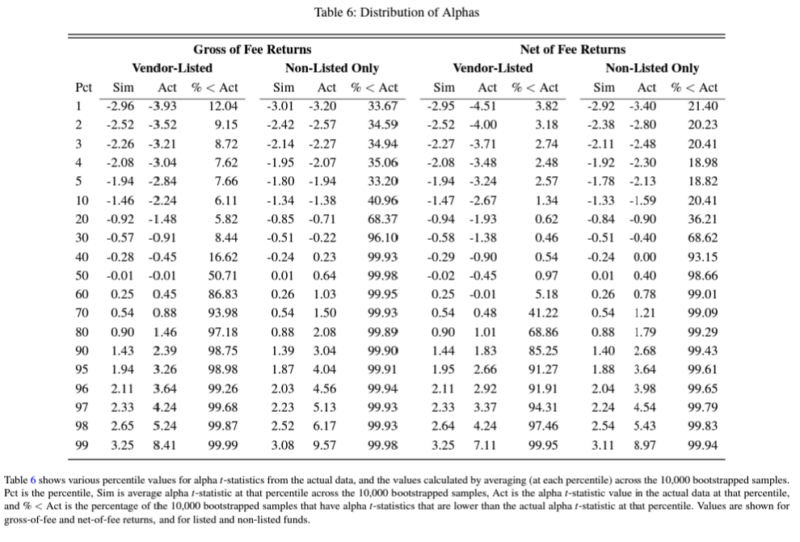
The results are hypothetical results and are NOT an indicator of future results and do NOT represent returns that any investor actually attained. Indexes are unmanaged and do not reflect management or trading fees, and one cannot invest directly in an index.
Third, the authors found that the non-listed funds had a much higher percentage of highly illiquid assets (40% vs. 16%) and that the funds with a higher percentage of illiquid assets earned greater alpha. While the 7-factor model included a traded liquidity factor, hedge funds can also invest in non-public securities, which are generally illiquid. Investors demand a premium for accepting the risk of illiquidity. Because the model only considered the liquidity premium in public securities, it seems likely that some, if not much, of the alpha generated by the non-listed hedge funds holding illiquid assets isn’t alpha (except when measured against the 7-factor model). Instead, it is an illiquidity premium. Thus, the findings of alpha are quite possibly overstated. Those non-listed funds holding illiquid assets do earn excess returns—but it’s not alpha; it’s compensation for risk. For investors who don’t need liquidity for all of their assets, this might be a good trade-off. However, even those investors should be aware that it’s not alpha.
Fourth, an important finding was the significant exposure to market beta of both listed and non-listed hedge funds. If they were truly hedging market beta risk, the betas would be close to zero. Investors who thought they were diversifying market risk and adding unique sources of risk would be mistaken.
Finally, many of the non-listed funds (especially the top performers) may be available only to larger institutional investors and perhaps very high-net-worth investors able to meet high minimums. These funds do not need to be listed on public databases, as they don’t need to raise capital. In addition, many successful non-listed hedge funds may be closed to new money (note the finding of net negative cash flows for non-listed hedge funds). Thus, even though this part of the industry is doing well at generating excess returns, you may not be able to partake in it.
Larry Swedroe is the author or co-author of 18 books on investing, including his latest Enrich Your Future.
The opinions expressed here are their own and may not accurately reflect those of Buckingham Wealth Partners. For informational and educational purposes only and should not be construed as specific investment, accounting, legal, or tax advice. Neither the Securities and Exchange Commission (SEC) nor any other federal or state agency have approved, determined the accuracy, or confirmed adequacy of this article. Certain information may be based on third party data and may become outdated or otherwise superseded without notice. Third-party information is deemed reliable, but its accuracy and completeness cannot be guaranteed. LSR-24-639
About the Author: Larry Swedroe
—
Important Disclosures
For informational and educational purposes only and should not be construed as specific investment, accounting, legal, or tax advice. Certain information is deemed to be reliable, but its accuracy and completeness cannot be guaranteed. Third party information may become outdated or otherwise superseded without notice. Neither the Securities and Exchange Commission (SEC) nor any other federal or state agency has approved, determined the accuracy, or confirmed the adequacy of this article.
The views and opinions expressed herein are those of the author and do not necessarily reflect the views of Alpha Architect, its affiliates or its employees. Our full disclosures are available here. Definitions of common statistics used in our analysis are available here (towards the bottom).
Join thousands of other readers and subscribe to our blog.