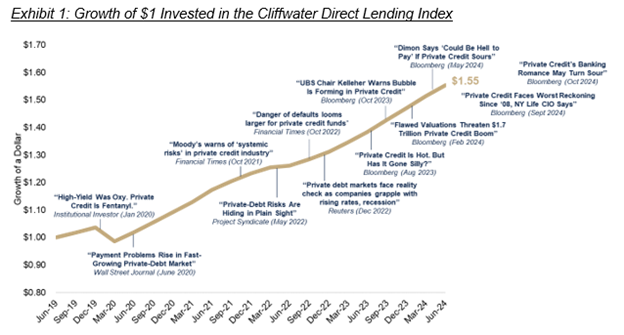
My October 19, 2024 Alpha Architect article examined the explosive growth in private credit and sought to answer the question was there a bubble as many pundits have been warning. The following chart shows the growth of $1 invested in the Cliffwater Direct Lending Index from June 2019 (the inception date of Cliffwater’s Corporate Lending Fund CCLFX) through June 2024. Through October 2024 CCLFX returned 9.62%, a 7.3% premium to one-month Treasury bills. The chart also shows examples of media warnings about the great risks and flawed valuations of private credit.
Signs of a Bubble Brewing?
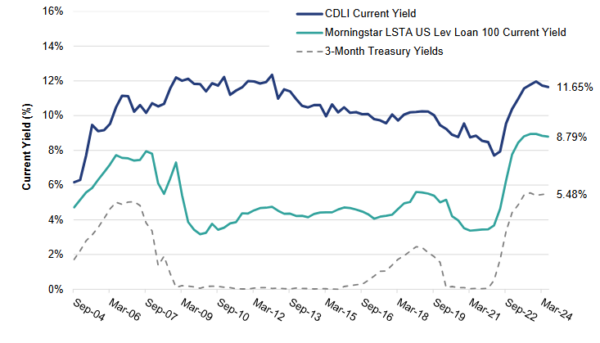
One sign of a bubble brewing in private credit would be that credit spreads had narrowed. My October article included the following chart about current yields demonstrating that there has been no decline in spreads. In fact, it shows that spreads are at their highest level.
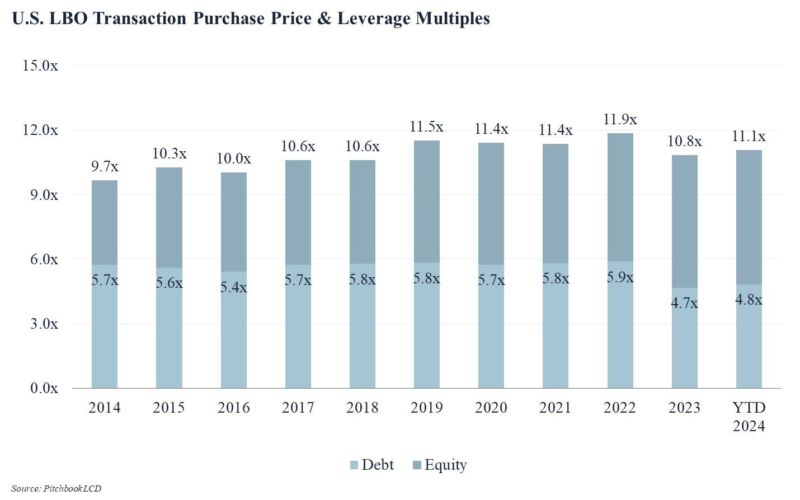
Another sign of a bubble brewing would be if the underlying fundamentals had deteriorated. We can examine the fundamentals to determine if that has been the case. In private equity-sponsored leveraged buyouts (LBOs), of which private direct lenders are the primary source of debt financing, sponsors typically pay purchase price multiples between 9x and 12x EBITDA and deals are typically structured with ~50% equity and ~50% debt. For example, a business generating $100 million in EBITDA and acquired for $1.2 billion (a 12x multiple) would typically require $600 million of equity alongside $600 million of senior financing. A 50% loan-to-value (LTV) structure at purchase price multiples of 9x to 12x results in a debt-to-EBITDA ratio of 4.5x to 6x. The chart below illustrates purchase price and leverage multiples over the past decade for U.S. LBO transactions, using data from Pitchbook LCD.
As you can see EBITDA multiples have been relatively stable over the past decade and, in fact, are now at their lowest levels of the period, reflecting greater caution and discipline from private lenders.
Exhibit 2: U.S. LBO Transaction Purchase Price & Leverage Multiples: A Historical Perspective
Here’s another way to look at the fundamentals of private credit. While the S&P 500 currently trades at a forward multiple of ~22x earnings, private equity transactions at 9x to 12x multiples look quite reasonable. If private debt were truly in a bubble, one would have to assume not only a collapse in valuations but a total wipeout of the PE sponsor’s equity cushion before the senior direct lender faces impairment. History suggests that is highly unlikely. Private equity sponsors have long demonstrated their ability to create value even during economic turbulence, and today’s valuations reflect disciplined underwriting rather than speculative froth. In other words, it isn’t a bubble, it’s prudent deployment of capital.
Investor Takeaway
While the media headlines are preaching doom, the fundamentals are telling a very different story—credit spreads have widened, and EBITDA multiples are the lowest they have been in a decade. The bottom line is that for investors able to accept its limited liquidity, private, senior, secured and sponsored by private equity direct lending continues to be a compelling component of a diversified portfolio deliver what has always attracted investors: high current income, resilience through market cycles, and a disciplined approach to risk management. We are far from a bubble.
Larry Swedroe is the author or co-author of 18 books on investing, including his latest Enrich Your Future.

About the Author: Larry Swedroe
—
Important Disclosures
For informational and educational purposes only and should not be construed as specific investment, accounting, legal, or tax advice. Certain information is deemed to be reliable, but its accuracy and completeness cannot be guaranteed. Third party information may become outdated or otherwise superseded without notice. Neither the Securities and Exchange Commission (SEC) nor any other federal or state agency has approved, determined the accuracy, or confirmed the adequacy of this article.
The views and opinions expressed herein are those of the author and do not necessarily reflect the views of Alpha Architect, its affiliates or its employees. Our full disclosures are available here. Definitions of common statistics used in our analysis are available here (towards the bottom).
Join thousands of other readers and subscribe to our blog.