Every year the markets provide us with lessons on prudent investment strategies. With great frequency, markets offer remedial courses covering lessons they taught in previous years. That’s why one of my favorite sayings is that there’s nothing new in investing, only investment history you don’t know. In 2024 investors were provided with nine lessons. Many of them are repeats from prior years. Unfortunately, too many investors fail to learn them—they keep making the same errors.
Lesson 1. No one who is very good at consistently getting market and economic forecasts right.
The only value in market strategist forecasts is that they show that a wide dispersion of outcomes is possible. The S&P 500 Index ended 2023 at 4,769.83. The forecasts of 20 analysts from leading investment firms for year-end 2024 ranged from as low as 4200 (down 12%) to as high as 5400 (up 13%). The average forecast was for the S&P 500 to end the year at 4,861 (+2%). It closed the year up 23%. Even the most optimistic Forecast underestimated Returns by 10%.
Despite the average forecast being wrong by such a wide margin, analysts had an almost perfect forecast of earnings for the S&P 500—they forecasted earnings of $243, and the current estimate is for earnings of about $243. If earnings can be forecasted with such clarity, one would think the market could be forecasted accurately as well. This example demonstrates why trying to time the market is a fool’s errand.
The following chart from Avantis shows that not only is such a wide dispersion of potential outcomes likely, but the median forecast is typically wrong by a wide margin.
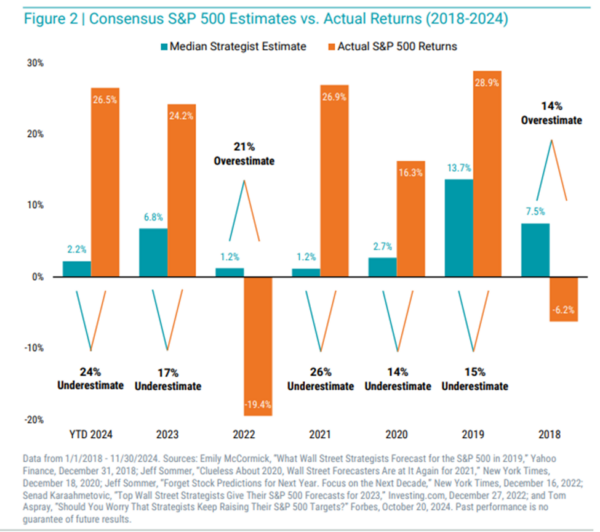
The results are hypothetical results and are NOT an indicator of future results and do NOT represent returns that any investor actually attained. Indexes are unmanaged and do not reflect management or trading fees, and one cannot invest directly in an index.
As you can see, in none of the last seven years was the consensus forecast, the wisdom of crowds, off by less than 14%.
The following is another example of why you should ignore forecasts, especially from so-called “gurus.”
In February 2024 GMO’s Jeremy Grantham warned that 2024 would show disappointing profits, a weakening economy, a mild recession—at least—and a tough year for the stock market, his chief advice was: “Avoid U.S. stocks.” The S&P returned 23% and US stocks were the best performing equities in the world.
Grantham became famous predicting the dotcom crash in 2000 and the financial crisis in 2008. While Grantham was correct twice (in 2000 and 2008), he was wrong in other years, not just 2024. For example, in April 2013 Grantham stated that equities were “brutally overpriced.” He forecasted that over the next 7 years, large-cap U.S. stocks would lose 0.8% per annum. In November 2013 he stated that they were 75% overvalued. Over the 7 years from April 2013 through March 2020, the S&P 500 returned 10.8% per annum, 11.6 percentage points more per year than Grantham forecasted.
A large body of research has found that market forecasts by experts are no better than random. Neither are survey forecasts. The 2023 study, “How Accurate Are Survey Forecasts on the Market?” examined three sets of survey forecasts: The Livingston Survey conducted by the Federal Reserve Bank of Philadelphia, The CFO Survey, and The Nagel and Xu Survey. The authors found that none beat a random walk forecast predicting future returns using the past sample mean. Unfortunately, there are no crystal balls that allow you to see the future clearly. Thus, when building a financial plan, a wide dispersion of potential outcomes must be considered, with investors being willing and able to accept the downside risks.
Lesson 2: Valuations cannot be used to time markets.
We entered 2023 with U.S. equity valuations at very high levels. In particular, the popular metric known as the Shiller CAPE 10 was about 28, well above the historical average of about 17. We had been above that for two Decades. That led many forecasters to predict poor returns. Investors who listened to that advice and sold equities missed out on the market’s strong performance as Vanguard’s S&P 500 ETF (VOO) returned 26.3%.
That strong performance drove the CAPE 10 even higher to 32, Leading forecasters to once again predict poor returns. Defying such forecasts, Vanguard’s VOO returned 25% in 2024.
In his 2012 study, Cliff Asness showed why one should not use the CAPE 10 to try to time markets. He found that when it was above 25.1, the real return over the following 10 years averaged just 0.5% – virtually the same as the long-term real return on the risk-free benchmark, one-month Treasury bills, and 6.3 percentage points below the U.S. market’s long-term real return. This concerned many investors, possibly leading them to reduce or even eliminate their equity holdings. But there was still a wide dispersion of outcomes: The best 10-year forward real return was 6.3%, just half a percentage point below the historical average, while the worst was -6.1%.
While valuations do provide information on future returns, the research has found that they do not provide information that allows investors to profitably time the market. For example, Cliff Asness, Swati Chandra, Antti Ilmanen and Ronen Israel, authors of the study “Contrarian Factor Timing Is Deceptively Difficult,” which appeared in the 2017 Special Issue of The Journal of Portfolio Management, found “lackluster results” when investigating the impact of value timing (in other words, whether dynamic allocations can improve the performance of a diversified, multistyle portfolio). They wrote: “Strategic diversification turns out to be a tough benchmark to beat.”
In addition, what many investors may not have been aware of is that when using traditional price-to-earnings (P/E) ratios, history shows there is virtually no correlation between the market’s P/E and how the market performs over the subsequent year. The following is a good reminder of that.
On January 1, 1997, the CAPE 10 was at 28.3. The highly regarded (at least at the time) Chairman of the Board of the Federal Reserve, Alan Greenspan, gave a talk in which he famously declared the U.S. stock market to be “irrationally exuberant.” That speech, given in Tokyo, caused the Japanese market to drop about 3%, and markets around the globe followed. Over the three years 1997 through 1999, the S&P 500 Index returned 33.4%, 28.6% and 21.0%, respectively, producing a compound return of 27.6%.
Summarizing, while valuations provide valuable information about future expected returns over the long term (there’s about a 0.4 correlation over 10-year periods), that doesn’t mean you can use that information to time markets. The evidence shows such efforts are likely to fail. This doesn’t mean, though, that the information has no value. You should use valuations to provide estimates of returns so you can determine how much equity risk you need to take in your portfolio to have a good chance of achieving your financial goals. But expected returns should only be treated as the mean of a potentially wide dispersion of outcomes. Your plan should address any of these outcomes, good or bad.
Lesson 3: it takes lots of patience and discipline to stay the course through periods of poor performance, as all risk assets go through them.
Investors must understand that all strategies that entail investing in risk assets are virtually guaranteed to experience long periods of underperformance. If you doubt that, consider that the S&P 500 Index has experienced three periods of at least 13 years when it underperformed riskless one-month Treasury bills (1929-43, 1966-82 and 2000-12). To gain the benefits of diversifying away from traditional 60/40 portfolios, you must have the discipline to stay the course (and even rebalance) during periods of negative performance.
Sadly, it’s my experience that when it comes to judging investment performance, investors think three years is a long time, five years is a very long time, and 10 years is an eternity. Financial economists know that when it comes to risk assets, 10 years is likely nothing more than noise – or the risks show up for which you are compensated with an expected, but not guaranteed, premium. If the premium were guaranteed, there would be no risk (and no premium). Investors who lack this understanding tend to abandon even well-thought-out strategies after a few years of underperformance. They fail to understand that underperformance typically results in much more favorable valuations and thus higher future expected returns.
The research on investor behavior has found that retail investors tend to underperform the very funds they invest in because they buy after periods of strong performance (when valuations tend to be high and expected returns low) and sell after periods of poor performance (when valuations tend to be low and expected returns high). In their 2023 study, “Mind the Gap,” Morningstar found that over the 10-year period ending in 2022, the average investor underperformed the funds they invested in by 1.7 percentage points per annum, losing about 20% of the available returns. The behavioral challenges to maintaining exposure to those premia are one reason they are likely to persist.
Two examples of the need for discipline are alternative investments–AQR’s Style Premia Alternative QSPRX and Stone Ridge’s SRRIX.
After returning 6.7% per annum from 2014 through 2017, a 6.4% premium over riskless one-month Treasury bills, QSPRX returned -12.3% in 2018, -8.1% in 2019 and -21.9% in 2020. That caused many investors to flee. In 2021, 2022, 2023, and 2024 the fund returned 25.0%, 30.8%, 12.8%, and 21.12% respectively. Sadly, many investors were not there to earn those great returns because they lost discipline.
Investors in SRRIX had a similar experience. After returning 11.0%, 7.9% and 6.4% in 2014, 2015 and 2016, respectively, producing an annualized return of about 8.4% (an 8.3% premium over one-month Treasury bills), SRRIX returned -11.4% in 2017, -6.1% in 2018 and -4.7% in 2019. That caused many investors to flee. The next two years the fund returned 6.8% and -6.5%, and investors continued to flee. In 2022 the fund returned 5.1%, in 2023 It returned 44.6%, and in 2024 it returned 33.1%. Sadly, by the end of 2022, the fund’s assets had shrunk from a peak of about $5 billion to about $1 billion. Thus, most investors missed out on 2023’s and 2024’s spectacular returns. In an annual investor letter, CEO Ross Stevens noted that performance chasing, engaging in resulting, recency bias, and the lack of patience and discipline led to the average investor in SRRIX underperforming the fund itself by almost 5% per annum.
The only way investors can benefit from diversification is to include unique risks (such as value stocks, international stocks and alternative investments) and to recognize that every risk asset will likely experience significantly long periods of underperformance. To get the benefits of what has been called the “only free lunch in investing” (diversification), you must have the discipline to stay the course, rebalancing a portfolio instead of allowing yourself to be subject to recency bias. In other words, diversification doesn’t eliminate the risk of losses. In addition, successful diversification requires accepting the fact that parts of your portfolio will behave entirely differently than the portfolio itself and may underperform a broad market index (such as the S&P 500) for a very long time. A wise person once said that if some part of your portfolio isn’t performing poorly, you are not properly diversified. Diversification isn’t easy. And losing unconventionally is harder because misery loves company. Investors should also be aware that that living through hard times is much harder than observing them in backtests, which helps explain why it’s difficult to be a successful investor – it’s our behavioral biases and the mistakes we make because we don’t know the historical evidence. The lesson is to not make the mistake of engaging in Resulting: Judging the quality of a decision by the outcome instead of by the quality of the decision-making process.
Nassim Nicholas Taleb, author of Fooled by Randomness, provided this insight into the right way to think about outcomes: “One cannot judge a performance in any given field by the results, but by the costs of the alternative (i.e., if history played out in a different way). Such substitute courses of events are called alternative histories. Clearly the quality of a decision cannot be solely judged based on its outcome, but such a point seems to be voiced only by people who fail (those who succeed attribute their success to the quality of their decision).”
In my book, Investment Mistakes Even Smart Investors Make and How to Avoid Them, the mistake of engaging in resulting is called “confusing before-the-fact strategy with after-the-fact outcome.” The mistake is often caused by “hindsight bias,” the tendency after an outcome is known to see it as virtually inevitable.
As John Stepek, author of The Sceptical Investor, advised: “To avoid such mistakes, you must accept that you can neither know the future, nor control it. Thus, the key to investing well is to make good decisions in the face of uncertainty, based on a strong understanding of your goals and a strong understanding of the tools available to help you achieve those goals. A single good decision can lead to a bad outcome. And a single bad decision may lead to a good outcome. But the making of many good decisions, over time, should compound into a better outcome than making a series of bad decisions. Making good decisions is mostly about putting distance between your gut and your investment choices.”
Ex-Secretary of The Treasury Robert Rubin explained it this way in his 2001 Harvard commencement address: “Individual decisions can be badly thought through, and yet be successful, or exceedingly well thought through, but be unsuccessful, because the recognized possibility of failure in fact occurs. But over time, more thoughtful decision-making will lead to better results, and more thoughtful decision-making can be encouraged by evaluating decisions on how well they were made rather than on outcome.”
Lesson 4: Risk Assets with poor performance have self-healing mechanisms.
When risk assets have poor returns, it is usually due to a combination of both poor performance (falling earnings or producing losses) and falling valuations. Because the best predictor we have of REAL future equity returns is the earnings yield (the inverse of the P/E ratio, or E/P), falling valuations means that future expected REAL returns are now higher. Investors subject to recency bias fail to understand that, leading them to sell instead of buying.
For example, after underperforming one-month Treasury bills from 1929-43, the CAPE 10 had fallen from 25.3 to just 10.7. From 1944 through 1965, the S&P returned 15.0%, outperforming one-month Treasury bills by 13.2 percentage points per annum.
Similarly, after underperforming one-month Treasury bills from 1966 through 1983, the CAPE 10 had fallen from 19.7 to just 9.8. From 1984 through 1999, the S&P 500 returned 18.1%, outperforming one-month Treasury bills by 12.3 percentage points per annum. And after underperforming one-month Treasury bills from 2000 through 2012, the CAPE 10 had fallen from 44.2 to 21.2. From 2013 through 2021, the S&P 500 returned 12.6% per annum, outperforming one-month Treasury bills by 11.0 percentage points per annum.
Falling valuations are a “self-healing” mechanism. Similarly, the S&P’s loss of 18.1% in 2022 resulted in the CAPE 10 falling from 38.3 to 28.3.
Similarly, when value stocks underperform growth stocks, the spread in valuations between the two widens. Since the spread in valuations informs future relative returns, a wider spread forecasts a higher value premium.
The same self-healing mechanism works with reinsurance and credit markets. When losses occurred due to the historic fires in California, not only did premiums rise dramatically but underwriting standards tightened (such that you could not buy insurance if you had trees within 30 feet of your home, and all brush had to be cleared for another 30 feet) and deductibles increased significantly (reducing the risk of losses). Destruction from hurricanes in Florida caused the same combination of events to occur (rising premiums and deductibles, and tougher underwriting standards). Those events are what led to the spectacular returns to reinsurance investments in 2023 and 2024.
The same self-healing mechanism works in lending markets as well. Not only are credit spreads wider after losses, but underwriting standards are tighter, with covenants strengthened. The lesson for investors is to remember that self-healing mechanisms are at work after periods of poor performance. Thus, sophisticated investors know that the winning strategy is to avoid being subject to recency bias and to follow Warren Buffett’s advice to avoid market timing, but if you cannot resist, “be fearful when others are greedy and be greedy only when others are fearful.” In addition, as we have discussed, don’t make the mistake of engaging in resulting.
Lesson 5: Even with a clear crystal ball, markets are unpredictable.
Imagine that on January 1, 2024, you were provided with a crystal ball that would enable you to see the major geopolitical and economic events of the coming year:
There would be no resolution to Russia’s war with Ukraine, with Russia Importing North Korean Troops to aid them.
- The mideast conflict spread from Gaza, to Syria, to Lebanon, and Yemen and Even Iran directly attacking Israel, threatening to spread into a regional conflict. Houthi rebels continue to attack ships in the Red Sea, disrupting oil supplies and driving up oil prices and insurance costs.
- Interest rates would remain higher for Longer with the Fed cutting rates just three times, each just 25 Basis points, as inflation proved stubborn.
- The manufacturing sector will be in recession throughout the year, with the U.S. ISM Purchasing Managers Index remaining below 50 (contracting).
- Consumer delinquencies will rise sharply, as will corporate bankruptcies.
- Economic and geopolitical forces will profoundly impact the commercial real estate market along with the banking sector that provides much of the credit. The office vacancy rate in San Francisco will hit a record high 35% (versus 3%-4% pre-pandemic). Other cities, like Chicago, will also set records for office vacancies.
- The fiscal deficit will balloon to over 6% with no sign of it coming down. Pushing the Debt-to-GDP ratio above 100%.
- Foreign investors will significantly lower their holdings of U.S. dollars.
In September the Fed began cutting interest rates, lowering the Fed Funds Rate three times, yet the yield on the 10-year Note rose almost 1%.
Given those facts, it’s hard to imagine that any investor would have predicted that the S&P 500 would return 25%. And it is likely that many investors would have sold equities given the negative news that was coming.
The lesson is that even if you could accurately predict events, you should not try to time markets based on forecasts.
Lesson 6: The strategy to sell in May and go away is a myth.
One of the more persistent investment myths is that the winning strategy is to sell stocks in May and wait until November to buy back into the market. Let’s look at the historical evidence.
Since 1926 it is true that stocks have provided greater returns from November through April than they have from May through October. That may be the source of the myth. The annualized premium of the S&P 500 Index over one-month Treasury bills was 7.15% from November 1926 through October 2024. The annualized premium of the portfolio from November through April was 10.65% compared to just 3.78% for the May through October portfolio. In other words, the equity risk premium from November through April has been more than twice the premium from May through October. Furthermore, the premium was negative more frequently for the May through October portfolio, with 33% of the six-month periods having a negative result compared to 27 percent of the six-month periods for the November through April portfolio.
Importantly, the May through October portfolio had a positive annualized equity risk premium of 3.32% per year, which means the portfolio still outperformed Treasury bills on average.
Let’s see how the strategy performed in 2024. The S&P 500 Index returned 14.1% from May through October, outperforming riskless one-month Treasury bills (which returned 2.7% by 11.4 percentage points.
What’s perhaps most interesting is that apart from the bear market year of 2022, the last year the “sell in May” portfolio outperformed the consistently invested portfolio was 2011. Yet, you can be sure that, come next May, the financial media will be raising the myth once again. A basic tenet of finance is that there’s a positive relationship between risk and expected return. To believe that stocks should produce lower returns than Treasury bills from May through October, you would also have to believe that stocks are less risky during those months—a nonsensical argument. Unfortunately, as with many myths, this one seems hard to kill off.
Lesson 7: Last year’s winners are just as likely to be this year’s dogs.
The historical evidence demonstrates that individual investors are performance chasers – they buy yesterday’s winners (after the great performance) and sell yesterday’s losers (after the loss has already been incurred). This causes investors to buy high and sell low – not a recipe for investment success. As I wrote in my book, The Quest for Alpha, that behavior explains the findings from studies that show investors tend to underperform the very mutual funds they invest in. For example, as cited in my book, a 2005 study published by Morningstar found that in all 17 fund categories they examined, the returns earned by investors were below the returns of the funds themselves. Unfortunately, a good (poor) return in one year doesn’t predict a good (poor) return in the next. In fact, great returns lower future expected returns, and below-average returns raise future expected returns.
The table compares the returns of various asset classes in 2023 and 2024. Sometimes the winners and losers repeated, but other times they changed places. For example, the best performer in 2023, the S&P 500 did repeat its first-place finish. However, the next to worst performer in 2023, US Prime Market (Large) Value stocks became the second-best performer in 2024. And the third and fourth best performers in 2023 dropped down to the 7th and 9th place, respectively, in 2024.
| Index | 2023 Rank/Return (%) | 2024 Rank/Return (%) |
| Domestic Indexes | ||
| S&P 500 Index | 1/26.3 | 1/25.0 |
| MSCI US Small Cap 1750 (gross dividends) | 2/19.1 | 4/11.0 |
| MSCI US Prime Market Value (gross dividends) | 10/9.0 | 2/14.7 |
| CRSP US Small Cap Value (gross dividends) | 5/15.9 | 3/12.4 |
| Dow Jones Select REIT | 7/14.0 | 5/8.1 |
| Bloomberg Total Return Commodity Index | 11/-7.9 | 8/5.4 |
| International Indexes | ||
| MSCI EAFE (net dividends) | 4/18.2 | 9/3.8 |
| MSCI EAFE Small Cap (net dividends) | 8/13.2 | 11/1.8 |
| MSCI EAFE Small Value (net dividends) | 6/15.4 | 10/2.7 |
| MSCI EAFE Value (net dividends) | 3/19.0 | 7/5.7 |
| MSCI Emerging Markets (net dividends) | 9/9.8 | 6/7.5 |
The results are hypothetical results and are NOT an indicator of future results and do NOT represent returns that any investor actually attained. Indexes are unmanaged and do not reflect management or trading fees, and one cannot invest directly in an index.
The results are hypothetical results and are NOT an indicator of future results and do NOT represent returns that any investor actually attained. Indexes are unmanaged and do not reflect management or trading fees, and one cannot invest directly in an index.
The lesson is that successful investing requires the discipline and patience to keep you from abandoning your long-term plan and avoid being subject to recency bias which results in performance chasing.
Lesson 8: Active management is a loser’s game in bull or bear markets.
Despite an overwhelming amount of research (summarized in my book The Incredible Shrinking Alpha) demonstrating that passive investing is far more likely to allow you to achieve your most important financial goals, most individual investor assets are still held in active funds. For example, S&P’s U.S. Persistence Scorecard has concluded: “Regardless of asset class or style focus, active management outperformance is typically relatively short-lived, with few funds consistently outranking their peers.” Unfortunately, investors in active funds continue to pay for the triumph of hope over wisdom and experience.
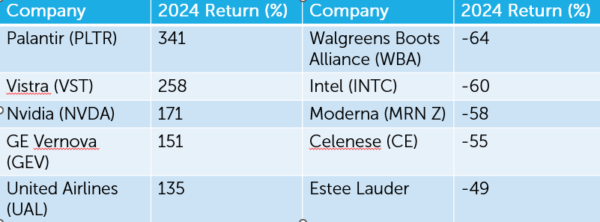
2024 was another year when active managers had a great opportunity to generate alpha through the large dispersion in returns between the year’s best-performing and worst-performing stocks. For example, while the S&P 500 Index returned 25.0% for the year, including dividends, the stocks of the five best performing companies were up at least 135%. To outperform, all an active manager had to do was overweight those big winners, each of which outperformed the index by at least 110 percentage points. On the other hand, 5 stocks lost at least 49 (underperforming the S&P 500 Index by 74 percentage points), with the worst performer losing 64 (underperforming the S&P 500 Index by 89 percentage points). To outperform, all an active manager had to do was underweight or avoid these dogs, each of which underperformed by at least 74 percentage points. This wide dispersion of returns is not at all unusual. Yet, despite the opportunity, year after year in aggregate active managers persistently fail to outperform.
The results are hypothetical results and are NOT an indicator of future results and do NOT represent returns that any investor actually attained. Indexes are unmanaged and do not reflect management or trading fees, and one cannot invest directly in an index.
Because indexes don’t incur expenses, while funds do, we need to compare the performance of active funds to those of live index/systematic funds. The following table shows the Morningstar percentile rankings for funds from two leading providers of nonactively managed funds – Dimensional (which are managed in a systematic, transparent and replicable manner) and Vanguard (which are index funds) – in 2024 and over the 15-year period ending December 2024.

The results are hypothetical results and are NOT an indicator of future results and do NOT represent returns that any investor actually attained. Indexes are unmanaged and do not reflect management or trading fees, and one cannot invest directly in an index.
In particular, note the longer the horizon, the higher the percentage of Vanguard’s and Dimensional‘s Fund Rank. At the 15-year horizon their domestic funds ranked in the 20th and 16th percentiles, respectively, and in international markets they ranked 41st and 24th percentiles, respectively. Since Morningstar’s data contains a significant amount of survivorship bias, as it only reflects funds that have survived the full period, with About 7% of actively managed funds disappearing every year, their returns buried in the mutual fund graveyard, the longer the period, the worse the survivorship bias becomes, and at 15 years it’s a large degree. For taxable investors, the data is even more compelling because taxes are typically the highest cost of active management. Thus, the survivorship bias-free, after-tax rankings for Vanguard and Dimensional funds would be significantly better.
The results make clear that active management is a strategy that can be “fraught with opportunity.” Year after year, active managers come up with an excuse to explain why they failed and then argue that next year will be different. Of course, it never is. I’ve never once heard an active manager forecast anything except that the coming year will be a “stock Picker’s Market” Even though it virtually has never happened.
Also note that even though Dimensional’s funds have higher expense ratios than Vanguard’s, their percentile ranks for both domestic and international funds were higher over the 15-year period ending 2024. The lesson is that while expenses are important, they should not be the only criteria you consider when selecting a fund that will provide exposure to the asset class/factors you are accessing.
Lesson 9: Diversification is always working; sometimes you like the results and sometimes you don’t.
Everyone is familiar with the benefits of diversification. It’s been called the only free lunch in investing because, done properly, it reduces risk without reducing expected returns. But once you diversify beyond a popular index such as the S&P 500, you must accept the fact that you will almost certainly be faced with periods (even long ones) when a popular benchmark index, reported by the media daily, outperforms your more diversified portfolio. The noise of the media will then test your ability to adhere to your strategy.
Of course, no one ever complains when their diversified portfolio experiences positive tracking variance (i.e., it outperforms the popular benchmark). The only time you hear complaints is when it experiences negative tracking variance (i.e., it underperforms the benchmark). As the table below demonstrates, 2024 was just such a year as US large stocks were the best performer, both domestically and globally.
The lesson for investors is that successful investing requires the discipline and patience to keep you from abandoning your long-term plan when diversification results in negative tracking variance to a broad market index.
Summary
Even smart people make mistakes. What differentiates them from fools is that they don’t repeat them, expecting different outcomes. 2025 will surely offer investors more lessons, many of which will be remedial courses. The market will provide opportunities to make investment mistakes. You can avoid making errors by knowing your financial history and having a well-thought-out plan. Reading my book “Investment Mistakes Even Smart People Make and How to Avoid Them” will help prepare you with the wisdom you need. And consider including in your New Year’s resolutions that you will learn from the lessons the market teaches.
My greatest hope is that you have learned that the key to successful investing is to get the plan right in the first place and then stick to it. That means imitating the lowly postage stamp, which does one thing but does it well—sticking to its letter until it reaches its destination. Your job is to stick to your well-developed plan until you reach your financial goals. And if you don’t have a plan, write one immediately. And make sure the plan includes the actions you are prepared to take if the “unexpected” happens (your “Plan B”).
Larry Swedroe is the author or co-author of 18 books on investing, including his latest Enrich Your Future.

About the Author: Larry Swedroe
—
Important Disclosures
For informational and educational purposes only and should not be construed as specific investment, accounting, legal, or tax advice. Certain information is deemed to be reliable, but its accuracy and completeness cannot be guaranteed. Third party information may become outdated or otherwise superseded without notice. Neither the Securities and Exchange Commission (SEC) nor any other federal or state agency has approved, determined the accuracy, or confirmed the adequacy of this article.
The views and opinions expressed herein are those of the author and do not necessarily reflect the views of Alpha Architect, its affiliates or its employees. Our full disclosures are available here. Definitions of common statistics used in our analysis are available here (towards the bottom).
Join thousands of other readers and subscribe to our blog.