Patient Capital Outperformance
- Cremers and Pareek
- A version of the paper can be found here.
- Want a summary of academic papers with alpha? Check out our Academic Research Recap Category.
Abstract:
This paper documents that among high Active Share portfolios – whose holdings differ substantially from the holdings of their benchmark – only those with patient investment strategies (i.e., with long stock holding durations of at least 2 years) outperform their benchmarks on average. Funds trading frequently generally underperform, regardless of Active Share.
Among funds that infrequently trade, it is crucial to separate closet index funds – whose holdings largely overlap with the benchmark – from truly active funds. The average outperformance of the most patient and distinct portfolios equals 2.30% per year – net of costs – for retail mutual funds. Stocks held by patient and active institutions in general outperform by 2.22% per year and by hedge funds in particular by 3.64% per year, both gross of costs.
Alpha Highlight:
We love passive investing because it tends to be low-cost and tax-efficient. There are a lot of great papers on this subject, and performance over the past few years has been stellar for passive managers–especially when compared to their over-priced closet-indexing friends. But we also believe–based on the evidence–that long-term active investors who are focused on the right process can do better than passive investing.
This paper, written by Cremers and Pareek, points out that frequent traders generally underperform patient investors, or investors with long duration holdings.
The paper also highlights that not all patient traders are wise and skilled. Among long-horizon fund operators, it is critical to distinguish between closet index funds and truly active funds.
- Highly Active Managed Funds: the proportion of portfolio weights that does not overlap with benchmark weights is higher than 90%.
- Closet index funds: the proportion of portfolio weights that does not overlap with benchmark weights is lower than 60%.
- Here’s an old post that explains these concepts: “Smart Beta is More Expensive Than You Think.“
Here’s the main finding of the paper:
- Only Active managers with a Long-Term View are rewarded for deviating from passive benchmarks.
Key Findings:
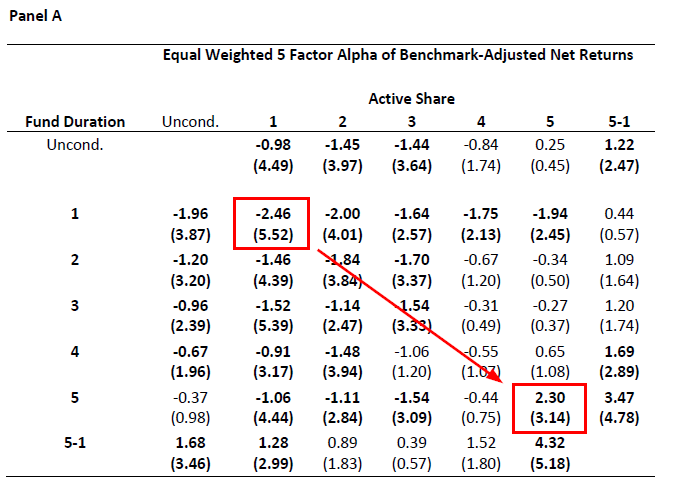
First, the authors use three proxies to measure how long funds hold stocks in their portfolios. The main metric is fund duration. Next, they sort portfolios into 5 quintiles from low holding duration to high holding duration. Following this, the authors double-sort portfolios into 5 quintiles based on how active they are (the proportion of portfolio weights that do not overlap with benchmark weights). Finally, they generate a 5*5 double sorted table.
This paper also test two groups of funds: retail mutual funds and institutional portfolios. The below table shows the performances of 25 retail mutual funds.
- Regardless of active share, funds which trade frequently generally underperform their benchmarks.
- Specifically, based on fund duration sort, quintile 1 underperforms quintile 5 on all share quintiles.
- Among high active share portfolios, only those with high holding duration are able to outperform their benchmarks on average.
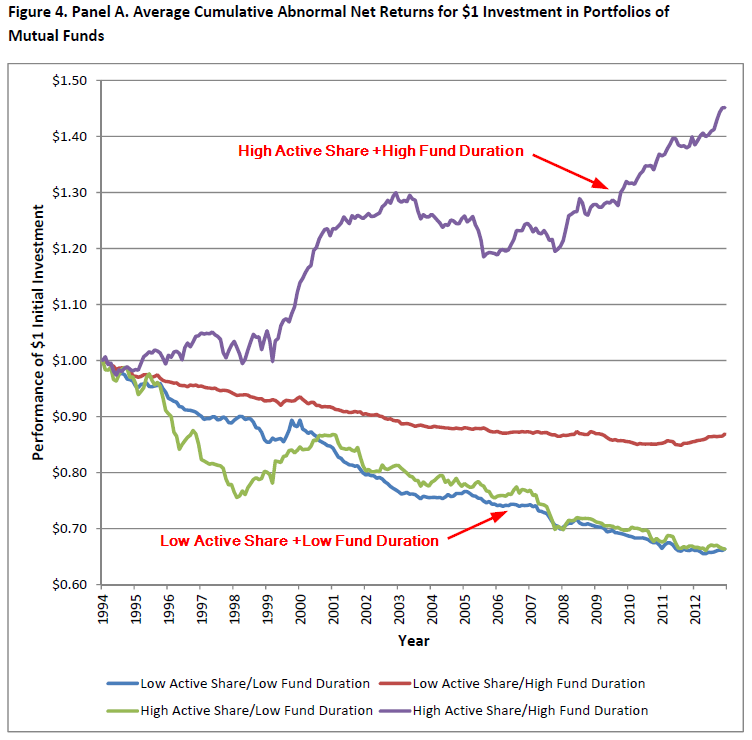
- The average outperformance of the most patient and active shares equals 2.3% per year, net of costs. Compounding from 1995 to 2013 generates a cumulative outperformance of 54%. On the other hand, The average underperformance of the most impatient and closet index funds equals –2.46% per year, net of costs. Compounding from 1995 to 2013 generates a cumulative loss of 38%.
The results are hypothetical results and are NOT an indicator of future results and do NOT represent returns that any investor actually attained. Indexes are unmanaged, do not reflect management or trading fees, and one cannot invest directly in an index. Additional information regarding the construction of these results is available upon request.
The results are hypothetical results and are NOT an indicator of future results and do NOT represent returns that any investor actually attained. Indexes are unmanaged, do not reflect management or trading fees, and one cannot invest directly in an index. Additional information regarding the construction of these results is available upon request.
What Factors Drive Outperformance?
In order to be better than average, we need to be different. In other words, the portfolio must have high active share. But a high active share strategy that buys growth stocks is simply going to underperform–a lot. We need to identify a process that actually exploits systematic behavioral problems.
We are personal fans of the CHEAPEST, HIGHEST QUALITY VALUE STOCKS. Guess what?
Active managers that outperform follow a similar process!
From the authors:
Their outperformance can largely be explained by their focus on stocks that other investors shun or find less attractive for their impatient strategies: picking safe (low beta), value (high book‐to‐market) and high quality (profitable, with growing profit margins, less uncertainty, higher payout) stocks and then sticking with those over relatively long periods.
Good luck!

About the Author: Wesley Gray, PhD
—
Important Disclosures
For informational and educational purposes only and should not be construed as specific investment, accounting, legal, or tax advice. Certain information is deemed to be reliable, but its accuracy and completeness cannot be guaranteed. Third party information may become outdated or otherwise superseded without notice. Neither the Securities and Exchange Commission (SEC) nor any other federal or state agency has approved, determined the accuracy, or confirmed the adequacy of this article.
The views and opinions expressed herein are those of the author and do not necessarily reflect the views of Alpha Architect, its affiliates or its employees. Our full disclosures are available here. Definitions of common statistics used in our analysis are available here (towards the bottom).
Join thousands of other readers and subscribe to our blog.