Momentum continues to receive much attention from researchers because of the strong empirical evidence. Out of the hundreds of exhibits in the factor zoo, momentum (both cross-sectional [long-short] and absolute [trend]) was one of just five equity factors that met all the criteria (persistent, pervasive, robust, implementable, and intuitive) Andrew Berkin and I established in our book “Your Complete Guide to Factor-Based Investing.”
While the original 1993 research on momentum by Narasimhan Jegadeesh and Sheridan Titman focused solely on U.S. common stock returns, momentum (both cross-sectional and trend) has been found almost everywhere: in global stocks, government and corporate bonds, commodities, currencies, stock portfolios, industries, and countries.
Charlie X. Cai, Peng Li, and Kevin Keasey contribute to the literature with their February 2024 study “Trended Momentum.” They began by noting that stocks with identical 12-month returns can have vastly different price paths. Despite that, standard momentum strategy tests treat these stocks as being the same during portfolio formation. For example, consider two stocks with the same total return (52%) over a 250-day trading period. However, their trend lines are very different. The charts below report a fitted trend line, its R-squared, and the information discreteness (ID) measures where ID = the number of down days minus the number of up days divided by the total number of days. (1)


The authors hypothesized that the stock with a clearer price path (Path A) signals a clearer momentum trend compared to those with erratic, volatile paths (Path B) that follow more of a zigzag pattern. They then tested whether the clarity of the price trend significantly influenced momentum traders, producing a more profitable momentum strategy. Their main empirical investigation focused on the conditional momentum effect in the U.S. market from 1926 to 2020. They analyzed the time trend of stock prices during a 12-month formation period with daily data, using the R-squared value from this time trend regression as a measure of trend clarity (TC).
They sorted stocks into quintiles based on cumulative returns from t-12 to t-1 (skipping month t, based on the well-documented reversal effect) in each month t. They then ranked stocks into quintiles based on the TC in each return quintile in each month t and computed the holding period returns and alphas (from t+1 to t+6) for each portfolio. Following is a summary of their key findings:
- Momentum strategy returns increased with clearer past price trends, exhibiting a consistent rise across TC quintiles.

- The highest TC portfolio, or “trended momentum,” achieved a six-month return of 5.67% (11.34% annualized), outperforming the standard momentum effect of 2.53% (5.06% annualized), as shown by a strong t-value of 8.11 in the equal-weighted portfolio.
- Similar findings were observed in value-weighted portfolios, with no momentum effect in the least clear trend quintile.
- Consistent with the momentum literature, there was weak or absent short-term reversal in all TC groups except the lowest clarity group (Group 1).
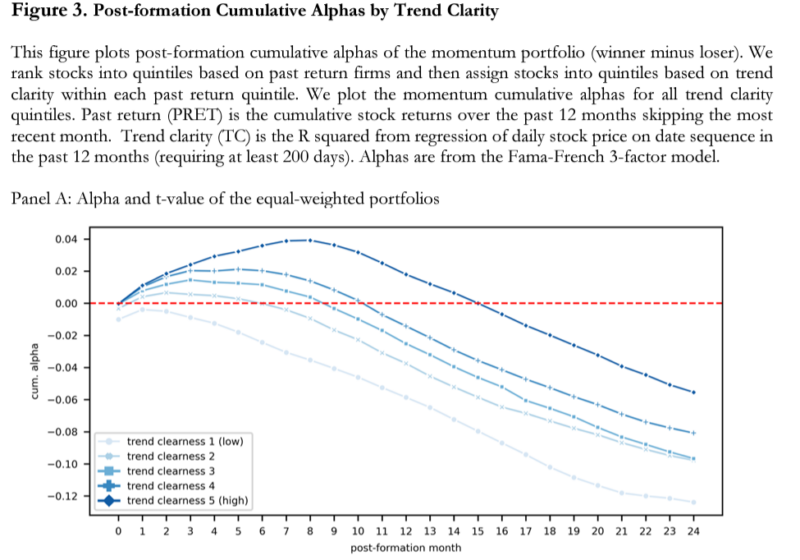
- The pattern of medium-term reversal after formation showed a predictable variation with trend clarity. While the group with the lowest clarity began to show reversal trends from the fourth month (t+4), the group with the highest clarity started exhibiting reversal patterns much later, from the 19th month (t+19)—underscoring the importance of trend clarity.
- The findings remained robust controlling for size, book-to-market ratio, liquidity, maximum return, and volatility effects, as well as for the Fama-French three– and five- factor models, the q-factor model, and the behavioral-factor model of Daniel, Hirshleifer, and Sun (2020).
Table 3. Trend Clarity and Momentum: Portfolio Alphas. This table presents the alphas of portfolios sorted sequentially. Initially, stocks are divided into quintiles each month based on their past return performance. Subsequently, within each quintile, stocks are further sorted into quintiles based on the trend proxy (R2). Past return refers to the cumulative stock return over the preceding 12 months, excluding the most recent month. Trend clarity (TC) is determined by the R2 from regressing daily stock prices against the date sequence over the same 12-month period, requiring a minimum of 200 trading days. The alphas for the winner minus loser (WML) portfolios are calculated using regression on holding period returns (from t+1 to t+6) against factors for each TC group and unconditional momentum strategy. Panels A and B display the equal- and value-weighted alphas, respectively, derived from factor models including the Fama-French 3- and 5-factor models (Fama and French, 2016), q4 (Hou, Xue, and Zhang, 2015), and BF3 (Daniel, Hirshleifer, and Sun, 2020). The estimation sample for the Fama-French 3-factor model comprises 3,243,951 observations from January 1927 to December 2020. For the Fama-French 5-factor model, the sample includes 2,882,103 observations from July 1967 to December 2020, as the data for the 5-factor model starts in July 1967. The q4 model’s alpha is estimated using 2,802,201 observations from January 1967 to December 2020. The behavioral factor model (BF3) alpha is based on a sample from July 1972 to December 2018, totaling 2,586,398 observations. t-stats are based on Newey-West standard errors. Significance levels of 1%, 5% and 10% are indicated by ***, ** and *.

- While existing models primarily explained the unclear trend momentum (low TC groups 1 and 2), they couldn’t account for clear trend momentum.
- While price trends during the formation period aligned with the trends in earnings surprises, these earnings trends ceased and started reversing in the post-formation period – trend-chasing is driven by investors using price trends as technical indicators rather than as rational responses to fundamental changes.
- The impact of trend clarity on momentum was more pronounced in smaller stocks, where information diffusion tends to be slower.
- There was a more pronounced effect of trend clarity on momentum during periods of high sentiment. However, even in low-sentiment periods where the unconditional momentum effect was absent, the trend clarity-enhanced momentum strategy yielded a significant positive return.
- Ahead of the formation period, the clarity of the price trend closely aligned with earnings surprises (the standardized unexpected earnings, or SUE). As SUE and the steepness of changes in SUE increased, so did trend clarity, suggesting that positive or negative news instigated the clear price trend. In addition, post-formation, the magnitude of SUE diminished and the trend reversed, indicating a deficiency of fundamentals to back the extrapolation by trend followers—confirming that the observed post-formation price momentum is a byproduct of over-extrapolation behavior and is an instance of mispricing.
- Incorporating trend clarity helped mitigate the risk of momentum crashes—while all momentum strategies in the TC quintiles produced negative returns during crashes, the severity of these negative returns progressively decreased as trend clarity increased.

- As an out-of-sample test, the findings were similar in 23 developed international markets. In 45 emerging markets, the momentum effect aligned with the earlier literature’s findings of weaker momentum, as only the most pronounced price trends generated momentum.
Their findings led Cai, Li, and Keasey to conclude:
“These findings confirm that clear trend perception is essential for momentum effects, indicating that significant price changes alone are insufficient to generate momentum. In summary, these findings demonstrate that the clarity of past price trends is a vital and necessary condition for driving the momentum phenomenon.”
Investor Takeaways
There is strong empirical evidence demonstrating that momentum (both cross-sectional and time-series) provides information on the cross-section of returns of many risk assets and has generated alpha relative to existing asset pricing models. Cai, Li, and Keasey contributed to the literature by providing a refined definition of momentum that enhances both theoretical and empirical understanding, as well as providing a way to enhance momentum strategies. It will be interesting to see if investment management firms incorporate their findings. The strong empirical evidence is why firms like Alpha Architect, AQR, Avantis, Bridgeway, and Dimensional, leaders in factor-investing strategies, incorporate momentum into their strategies. For example, based on research demonstrating the persistence of factor momentum, AQR recently added cross-sectional stock market factor momentum to their general managed futures strategy. Individual investors can utilize momentum strategies without incurring additional costs by incorporating momentum into trading decisions. For example, when rebalancing, they can delay purchases of assets with negative momentum and delay sales of assets with positive momentum.
Larry Swedroe is head of financial and economic research for Buckingham Wealth Partners, collectively Buckingham Strategic Wealth, LLC and Buckingham Strategic Partners, LLC.
All opinions expressed are solely his opinions and do not reflect the opinions of Buckingham Strategic Wealth or its affiliates. This information is provided for general information purposes only and should not be construed as financial, tax or legal advice. Certain information is based on third party data and may become outdated or otherwise superseded without notice. Third-party information is deemed reliable, but its accuracy and completeness are not guaranteed. Neither the Securities and Exchange Commission (SEC) nor any other federal or state agency have approved, determined the accuracy, or confirmed the adequacy of this information. LSR 24-651.

References[+]
| ↑1 | see frog-in-the-pan concept as well |
|---|
About the Author: Larry Swedroe
—
Important Disclosures
For informational and educational purposes only and should not be construed as specific investment, accounting, legal, or tax advice. Certain information is deemed to be reliable, but its accuracy and completeness cannot be guaranteed. Third party information may become outdated or otherwise superseded without notice. Neither the Securities and Exchange Commission (SEC) nor any other federal or state agency has approved, determined the accuracy, or confirmed the adequacy of this article.
The views and opinions expressed herein are those of the author and do not necessarily reflect the views of Alpha Architect, its affiliates or its employees. Our full disclosures are available here. Definitions of common statistics used in our analysis are available here (towards the bottom).
Join thousands of other readers and subscribe to our blog.