In the research reviewed here, the authors analyze the relationship of aggregate market liquidity to the time-series performance of reversal strategies. The strength and persistence of reversals and reversal driven strategies appear to be different depending on specific risk features of those providing market liquidity to the stock.
Reversals and the Returns to Liquidity Provision
- Wei Dai, Mamdouh Medhat, Robert Novy-Marx & Savina Rizova
- Financial Analysts Journal
- A version of this paper can be found here
- Want to read our summaries of academic finance papers? Check out our Academic Research Insight category.
What are the research questions?
- What is the main hypothesis?
- What are the main results?
What are the Academic Insights?
- HYPOTHESIS: Features of stock-level liquidity from providers of liquidity influence the strength and persistence of short-run reversals and reversal strategies. Market-making capacity is positively related to stock size; the inventory risk of the provider of liquidity is positively related to volatility; and inventory duration of the liquidity provider is negatively related to their inventory turnover. Reversals should consequently be stronger among smaller and more volatile stocks and more persistent among stocks with lower turnover.
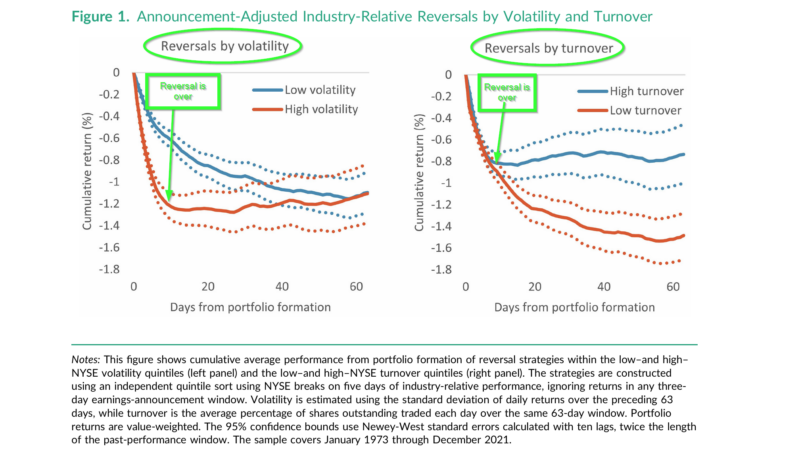
- RESULTS CONFIRM THE HYPOTHESIS. The authors of this article provide strong empirical results that “volatility is positively related to the inventory risk of liquidity providers and turnover is negatively related to their inventory duration.” The key to the analysis presented here lies in controlling the impact of announcements or “news” about a stock. Announcement-adjusted, industry-relative reversals are used to analyze returns to the liquidity provision. Volatility and turnover produced different footprints on the time-series behavior of the reversal effect that can be used to enhance reversal strategies. Specifically, higher volatility produced a faster reversal that is only weakly persistent. Lower turnover produced persistent and much stronger reversal effects. Now focus on Figure 1 below. On the right, find the average cumulative return (CAR) spread for winner/loser stocks when the universe is limited to high vs. low volatility stocks. Note the first few weeks, there is little to no effect on the size of the spread but a large effect on the persistence of the spread. For low turnover stocks, the reversal effect increases for approximately 3 months. For high-turnover stocks, the reversal ends after two weeks. Low turnover stocks produce a higher return spread. On the left side of Figure 1, the same spread is calculated among high or low volatility stocks. In that case, the reversals are faster and stronger among the high volatility group and markedly different from the low volatility group. Low vol (blue line) is best. Low turnover (red line) is best.
Why does it matter?
I would point to several contributions. First, the study isolates the impact of volatility and turnover associated with the providers of liquidity and the associated returns to reversal strategies. The authors conclude:
- Volatility matters more for reversal magnitudes because it captures inventory risk associated with alleviating order imbalances and thus the compensation demanded for supplying liquidity
- Turnover matters more for reversal persistence, because it captures inventory duration and thus the time it takes liquidity suppliers to unwind the positions they accrue.
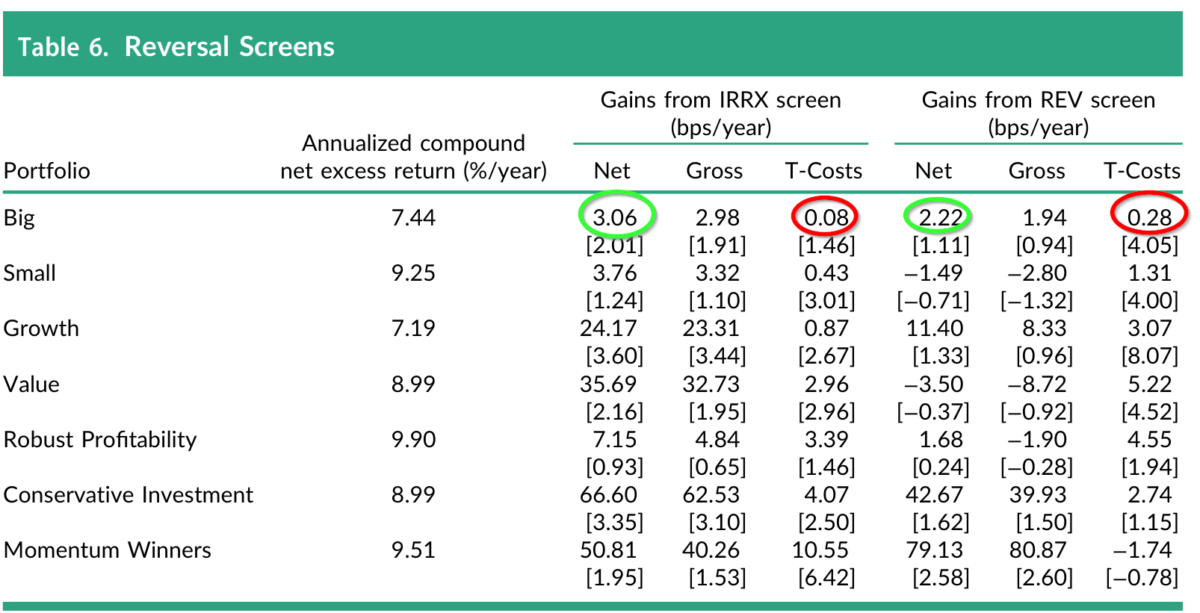
Second, the practical implications for constructing better reversal strategies are powerful. The results from using the screen tested in this paper (IRRX) were compared to the results obtained from screens typically used in common reversal strategies. The value added by using the announcement-adjusted, industry-relative reversal (IRRX) is presented in Table 6. With the exception of Momentum Winners, the improvement in net returns, gross returns and transactions costs is compelling.

The results are hypothetical results and are NOT an indicator of future results and do NOT represent returns that any investor actually attained. Indexes are unmanaged and do not reflect management or trading fees, and one cannot invest directly in an index.
One important caveat: The results were robust to stocks held and traded outside of the US. even though the length of the sample is shorter and the data less well-populated.
The most important chart from the paper

The results are hypothetical results and are NOT an indicator of future results and do NOT represent returns that any investor actually attained. Indexes are unmanaged and do not reflect management or trading fees, and one cannot invest directly in an index.
Abstract
Different aspects of liquidity impact the performance of short-run reversals in different ways, consistent
with the predictions of microstructure models. Higher volatility is associated with faster, initially stronger reversals, while lower turnover is associated with more persistent, ultimately stronger reversals. These
facts also hold outside the US and explain several seemingly disparate results in the literature.
About the Author: Tommi Johnsen, PhD
—
Important Disclosures
For informational and educational purposes only and should not be construed as specific investment, accounting, legal, or tax advice. Certain information is deemed to be reliable, but its accuracy and completeness cannot be guaranteed. Third party information may become outdated or otherwise superseded without notice. Neither the Securities and Exchange Commission (SEC) nor any other federal or state agency has approved, determined the accuracy, or confirmed the adequacy of this article.
The views and opinions expressed herein are those of the author and do not necessarily reflect the views of Alpha Architect, its affiliates or its employees. Our full disclosures are available here. Definitions of common statistics used in our analysis are available here (towards the bottom).
Join thousands of other readers and subscribe to our blog.

