The Stock Market Valuation of Research and Development Expenditures
- Louis Chan, Josef Lakonishok, and Theodore Sougiannis
- A recent version of the paper can be found here.
- Strategy will soon be available on https://alphaarchitect.com/
Abstract:
We examine whether stock prices fully reflect the value of firms’ intangible assets, focusing on research and development (R&D). Since intangible assets are not reported on financial statements under current U.S. accounting standards and R&D spending is expensed, the valuation problem may be especially challenging. Nonetheless we find that historically the stock returns of firms doing R&D on average matches the returns on firms with no R&D. For companies engaged in R&D, high R&D intensity has a distinctive effect on returns for two groups of stocks. Within the set of growth stocks, R&D-intensive stocks tend to out-perform stocks with little or no R&D. Companies with high R&D relative to equity market value (who tend to have poor past returns) show strong signs of mis-pricing. In both cases the market apparently fails to give sufficient credit for firms’ R&D investments. Our exploratory investigation of the effects of advertising on returns yields similar results. We also provide evidence that R&D intensity is positively associated with return volatility, everything else equal. Insofar as the association reflects investors’ lack of information about firms’ R&D activity, increased accounting disclosure may be beneficial.
Data Sources:
The authors use CRSP for return data and Compustat for various financial data. The sample period is 1975 through 1995.
Discussion:
Anomalies associated with research and development expenditures have peppered the empirical asset pricing literature a few times over the years. A few examples:
- http://elsa.berkeley.edu/~bhhall/papers/BHH%20AEA93%20R&Dval.pdf
- http://www.jstor.org/pss/3694909
- http://www.fma.org/Denver/Papers/AdvertisingInvestment_StockReturns_FMA_20110113.pdf
The “R&D anomaly” research is especially intriguing because not a lot of investors know about it, nor do they attempt to trade on these strategies–investors are much more focused on traditional “value” anomalies.
My favorite R&D anomaly paper is the current paper under discussion. The approach is very simple and effective, yet easy to understand and comprehend–yes, even a purple dinosaur could understand it.
Before we dive into the specifics of this trading strategy, its always nice to understand the economics driving the market mispricing. Like many other anomalies, the hypothesis for why the R&D anomaly exists is related to behavioral limitations: Specifically, the human inability to look beyond their nose. The fancy term for this is “myopia,” or according to the official Marine Corps dictionary, “Dumbassery.”
In the case of research and development investments, it is difficult for investors to link an intangible asset into actual value. Often, investors enjoy the intellectual lay-up of focusing on tangible asset value and comparing that value to the market value–the famous Ben Graham “cigar butt hunting” strategy is a perfect example. With intangible assets, connecting “asset value” to market value is much trickier: how the heck do we figure out how many additional soda cans are sold just because they say “Coke” on the side of them?
So now we are set up for an easy thought experiment: let’s pretend company X has invested $500mm in research and development over the past 2 years. Company X has also just had a bad run in the market because one of their prior investments went bust (bad luck, not bad management)–the current market cap is $50mm and the stock is hated. Here is the question: the company has invested $500mm in R&D, which presumably will have some sort of payoff; and assuming management isn’t totally idiotic, the value of the return on that R&D investment will presumably be worth a lot more than the current $50mm market cap!
Now imagine the same situation occurred with a tangible investment: company X buys $500mm worth of brand new tractors. Company X’s market cap is now $50mm. If you are like any other value investor you immediately think: “Okay, $500mm in brand new tractors, let’s fire sale them at 50% of book, we now have $250mm in value. Let’s say liquidation costs $100mm, now we are at $150mm in value…and that is 3x current market cap. Margin of safety: check. Graham approved: check.”
Hopefully, one can now see why R&D investments, while very different in nature, can create “cigar-butt” situations that are similar to actual cigar-butt situations.
On to the strategy…
The authors examine a variety of measures to capture the returns from the R&D trading strategy. The version that works best is simply R&D expenditures / Market Cap. Where R&D expenditures are calculated as follows:

The authors use a basic capital amortization rate to reflect the reality that R&D spent later is less productive than R&D spent more recently.
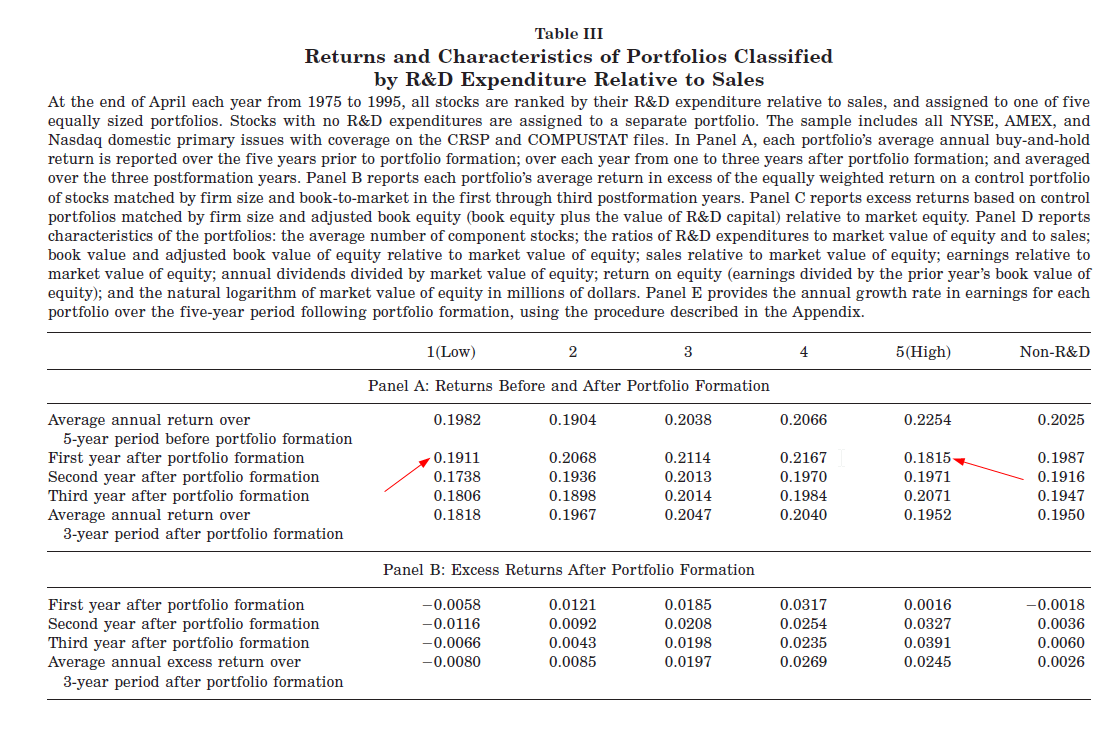
The first thing the authors find is that RDC/Sales is not a very effective way to separate winners from losers–just because you spend a lot on R&D to generate sales, doesn’t mean you will outperform…d’uh.
The results are hypothetical results and are NOT an indicator of future results and do NOT represent returns that any investor actually attained. Indexes are unmanaged, do not reflect management or trading fees, and one cannot invest directly in an index. Additional information regarding the construction of these results is available upon request.
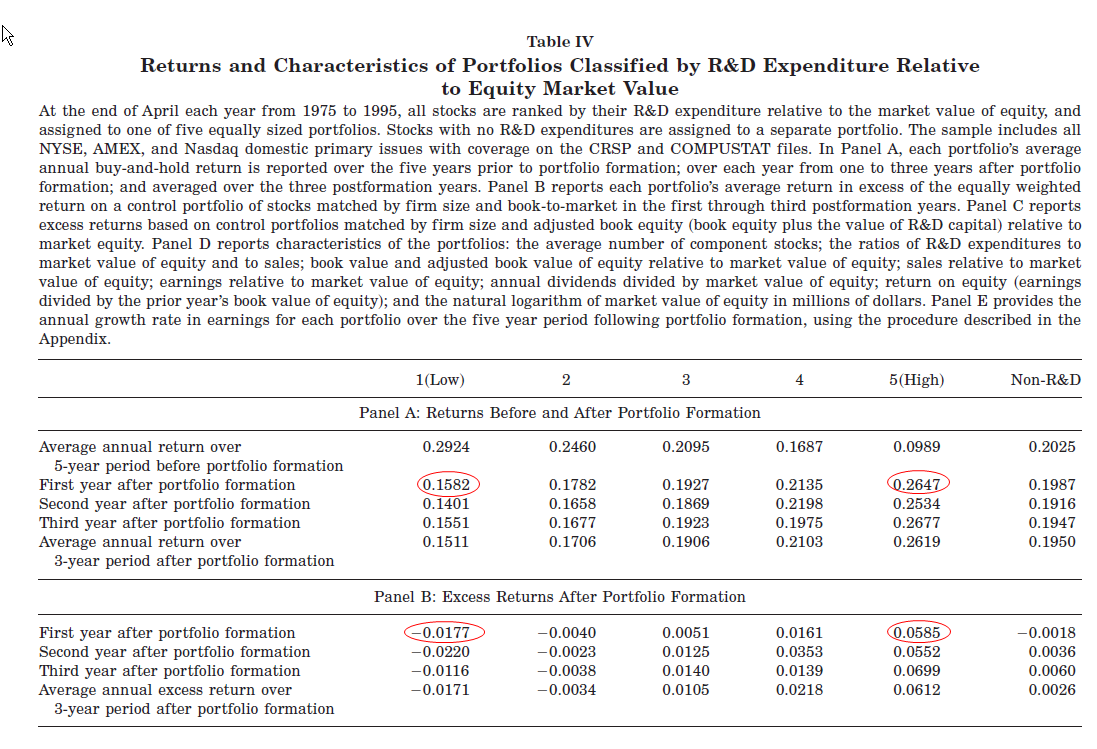
But here is where it gets intersting: instead of diving RDC by sales, divide it by market cap. Here are the results:
Not too shabby: buying cheap R&D assets seems like a great strategy! Excess returns run around 6%/year for the best portfolio, -2%/year for the worst portfolio.
The results are hypothetical results and are NOT an indicator of future results and do NOT represent returns that any investor actually attained. Indexes are unmanaged, do not reflect management or trading fees, and one cannot invest directly in an index. Additional information regarding the construction of these results is available upon request.
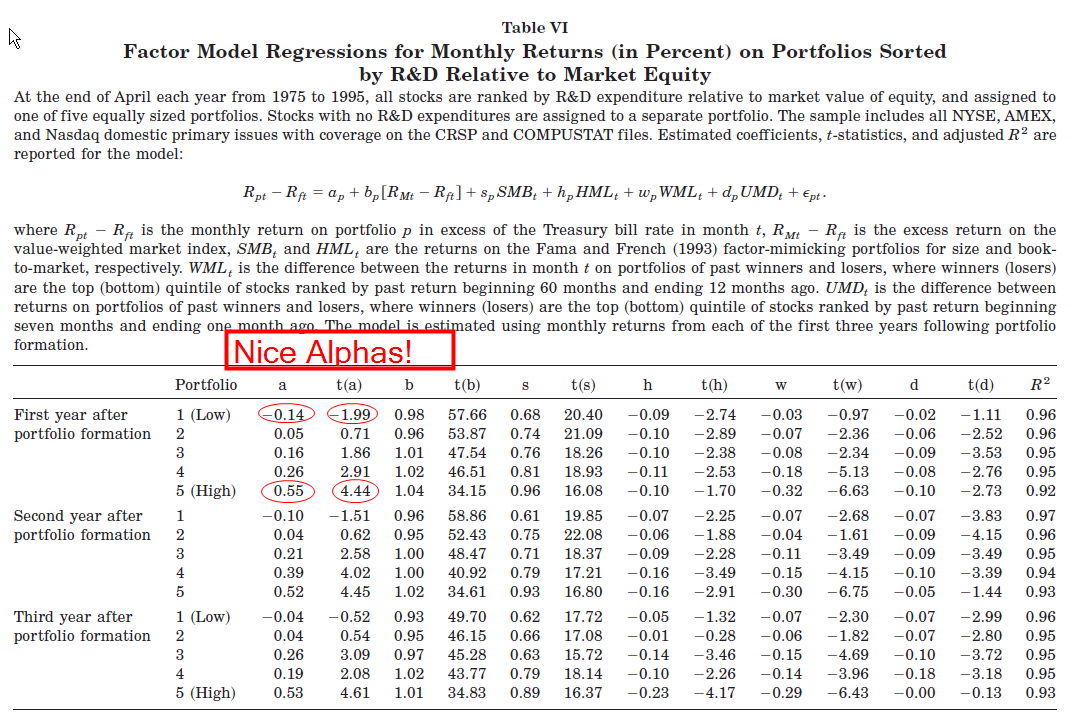
Now, the astute market observer will say, “Well, this is great, but isn’t this just a momentum strategy in disguise. We already know momentum works!” To combat this claim, the users control for the momentum factor(s) (WML and UMD) and generate the following table:
The results are hypothetical results and are NOT an indicator of future results and do NOT represent returns that any investor actually attained. Indexes are unmanaged, do not reflect management or trading fees, and one cannot invest directly in an index. Additional information regarding the construction of these results is available upon request.
After controlling for the ‘kitchen sink’ of factors, the authors still find alphas of around 55bp/month, or roughly 6%/year.
Investment Strategy:
- Calculate RDC–basically a weighted basket of historical R&D figures. Divide RDC by current market cap.
- Rank stocks: high RDC/Mkt Cap==> good, low RDC/Mkt Cap ==> bad
- Make money
Commentary:
One can be certain that any research Joseph Lakonishok puts his hands on will have some sort of “alpha magic.” As a founding member of LSV Asset Management–a multi-gazillion dollar asset manager– Joseph has had an opportunity to test his ideas in an academic environment as well as in a practical environment.
Given Lakonishok wrote this paper and identified R&D alpha almost 10 years ago, the downside of this strategy is that the “secret is out and big money is likely chasing it.” Nonetheless, let’s say LSV is putting their $100B AUM solely into the R&D alpha strategy (not actually happening and/or possible, but let’s pretend), as long as the mutual funds are putting in TRILLIONS of money and aren’t smart enough to pick up on the R&D alpha, the battle of TRILLIONS vs. $100B still goes to the “dumb money.”
My other complaint on this paper and the analysis of this strategy is with respect to the drawdowns and risk metrics. R&D firms are typically tech firms that are known to swing around wildly from time to time–perhaps we’ll investigate some of the more relevant practitioner-based risk metrics we highlight in our performance section.
And finally, this strategy was not tested beyond the tech crash–would be interesting to see if all the alpha of the past 20 years vanish following the internet blow up.
About the Author: Wesley Gray, PhD
—
Important Disclosures
For informational and educational purposes only and should not be construed as specific investment, accounting, legal, or tax advice. Certain information is deemed to be reliable, but its accuracy and completeness cannot be guaranteed. Third party information may become outdated or otherwise superseded without notice. Neither the Securities and Exchange Commission (SEC) nor any other federal or state agency has approved, determined the accuracy, or confirmed the adequacy of this article.
The views and opinions expressed herein are those of the author and do not necessarily reflect the views of Alpha Architect, its affiliates or its employees. Our full disclosures are available here. Definitions of common statistics used in our analysis are available here (towards the bottom).
Join thousands of other readers and subscribe to our blog.