We’re often asked:
Why does value investing work? You guys simply buy crappy high-risk companies. Of course you outperform.
I typically agree with claims that markets are efficient. In fact, I highlight this point in each of my classes using the figure below. I ask my students to answer a simple set of questions. First, do you think you can beat the chain-smoking math PhD genius Jim Simons? Next, I ask them if they should believe claims made by Bernie Madoff that he can magically make 1% a month in perpetuity? Then I highlight that assuming the efficient market hypothesis is true is the ultimate form of “margin of safety” because it prevents us from being overconfident and making stupid decisions. This is a long way of saying I take efficient markets serious and fully understand there is no easy money in the stock market (or anywhere for that matter). All that said, there seems to be a compelling behavioral finance reason cheap stocks beat expensive stocks:
- Human beings suffer from representative bias and cause prices to get out of wack.
- Limits of arbitrage–in other words, smart people with a ton of money can’t easily push prices back to fundamentals.
The original behavioral explanation for the outperformance of value stocks was written by Lakonishok, Shleifer and Vishny in 1994. The bias they describe is referred to as representative bias, where investors naively extrapolate past growth rates. The results related to mean-reversion are highlighted in the chart below. Notice how cheap stocks (based on B/M) have terrible fundamental stats over the past 5 years (panel B), but then systematically mean-revert over the next 5 years (see panel C). You’ll also notice the same effect for expensive stocks, but the effect works in reverse. The stats are great over the past 5 years (hence the high price), but over the next 5 years the stats systematically go down to levels similar to the value stocks.
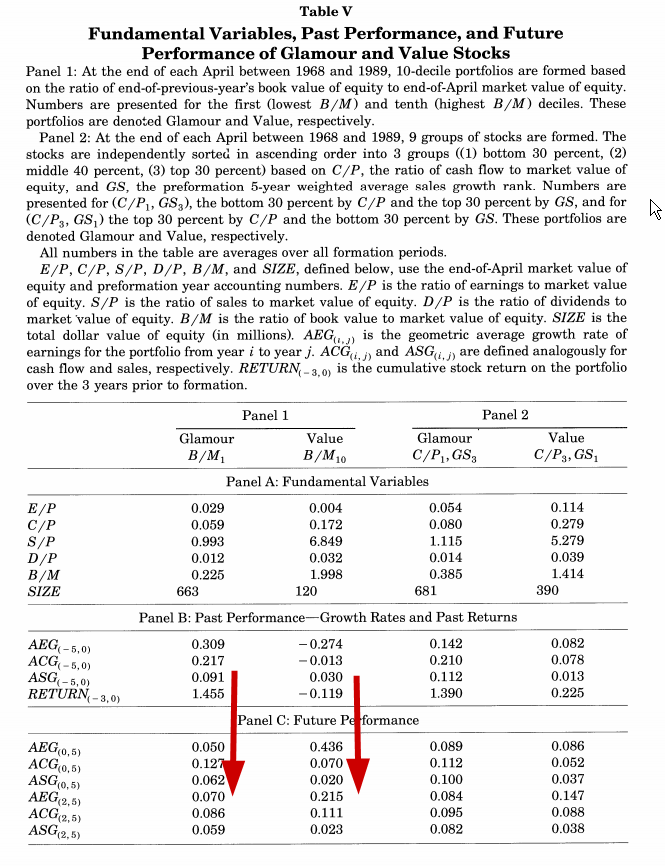
The results are hypothetical results and are NOT an indicator of future results and do NOT represent returns that any investor actually attained. Indexes are unmanaged, do not reflect management or trading fees, and one cannot invest directly in an index. Additional information regarding the construction of these results is available upon request.
This phenomenon was also studied by Dechow and Sloan in 1997. The chart below first splits firms into 10 buckets based on their price. The left bucket contains the most expensive firms, while the far right bucket contains the cheapest firms. The black bars represent past earning growth rates, while the blue bars represent future earning growth rates. Examining the black bars (past earnings) one can see that more expensive firms had higher past growth rates, while cheap securities had the lowest earnings growth rates. Investors see these past growth rates, and extrapolate them into the future through their own buying and selling, which is why growth stocks are expensive, while value stocks are cheap. However, investors fail to account for mean reversion. As one can see with the blue bars, future earnings growth rates mean revert. The blue bars are all similar. We notice that those expensive securities now have lower growth rates, while cheap securities now have higher growth rates. The reality is these earnings growth rates bounce back for value stocks, and when they bounce back, it surprises the market and investors buying cheap stock make high risk-adjusted returns, on average. As long as the marketplace fails to understand growth rate mean reversion, there will be a systematic spread between value and growth stocks over the long haul.

The results are hypothetical results and are NOT an indicator of future results and do NOT represent returns that any investor actually attained. Indexes are unmanaged, do not reflect management or trading fees, and one cannot invest directly in an index. Additional information regarding the construction of these results is available upon request.
We can also look at this from the perspective of analysts forecasts. In the chart below, the authors look at the relationship between the EPS Growth forecasted by sell-side analysts and the actual EPS growth (note, the sample used below is different than the sample above due to I/B/E/S data constraints). What do we see?
A few things:
- systematic sell-side overoptimism
- mean-reversion unappreciated by sell-side analysts
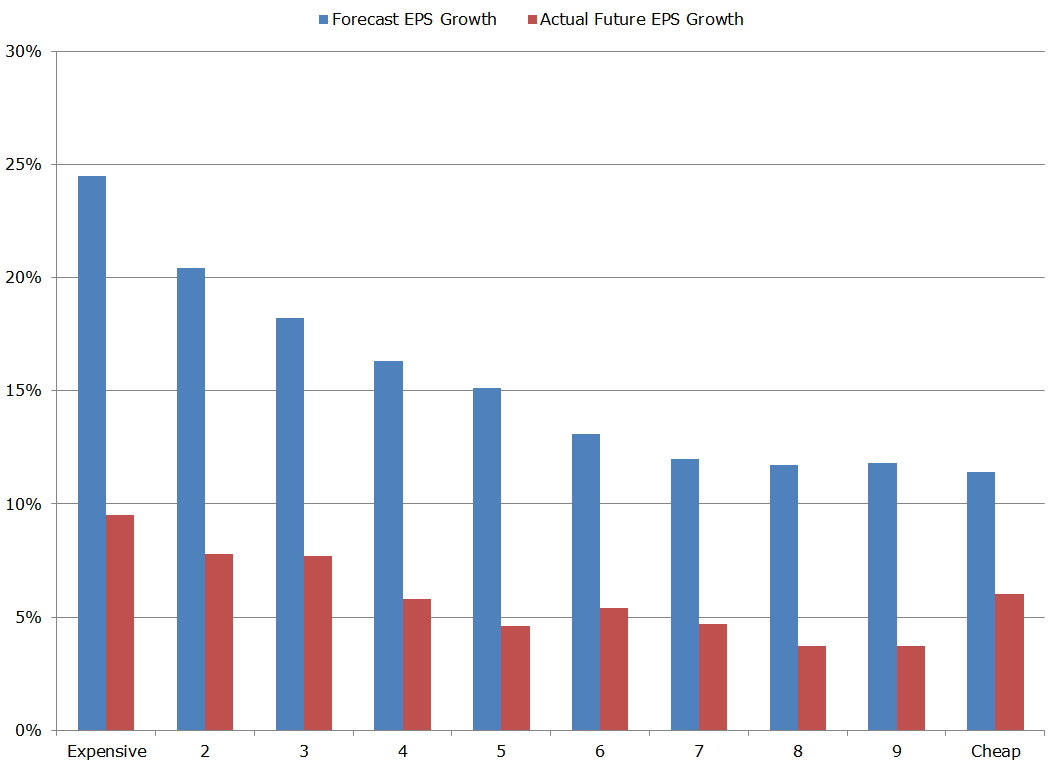
The results are hypothetical results and are NOT an indicator of future results and do NOT represent returns that any investor actually attained. Indexes are unmanaged, do not reflect management or trading fees, and one cannot invest directly in an index. Additional information regarding the construction of these results is available upon request.
The evidence seems fairly clear that markets, on average, throw cheap stocks under the bus and clamor towards expensive stocks at their own peril.
So why isn’t everyone a value investor?
Answer: Limits of arbitrage.(1)
The efficient market hypothesis predicts that prices reflect fundamental value. Why? People are greedy and any mispricings are immediately corrected by arbitragers.
But in the real world, true arbitrage–profits earned with zero risk after all possible costs–rarely, if ever, exist. Most arbitrage-like trades involve some form of cost or risk. This could mean fundamental or basis risk, transaction costs, or noise trader risk. Nick Barberis and Dick Thaler outline the fundamental misunderstanding with respect to the efficient market hypothesis (EMH). First, EMH correctly identifies that if prices are actually correct, there are no free lunches. Supporters of EMH often point to the extreme difficulty professional money managers have trying to beat simple passive indexes as evidence for efficient prices. However, the evidence that managers rarely add value doesn’t mean the EMH is correct. The limits to arbitrage concept highlights that evidence for no free lunch DOES NOT necessarily imply prices are correct. Basic example:
- Oranges in Florida cost $1 per orange.
- Oranges in California cost $2 per orange.
- The fundamental value of an orange is $1 (Assumption for the example).
- The EMH suggests arbitragers will buy oranges in Florida and sell oranges in California until California oranges drop to $1. Prices will quickly correct and there is no free lunch.
- But what if it costs $1 to ship oranges from Florida to California? Prices are decidedly not correct–the fundamental value of an orange is $1. But there is also not a free lunch. So therefore, No Free Lunch does not imply prices are correct. QED.
What can cause limits to arbitrage?
Consider an example where Ford has a fundamental value of $10 and GM has a fundamental value of $10. Currently, Ford trades at $8 and GM at $10. In order to complete the arbitrage, a trader would need to buy Ford, but then simultaneously hedge market risk and car company risk. GM is probably a good option, since it is a car company and shares some of the same fundamental risks as Ford. The trade is to long Ford, short GM. What are the potential issues with this “arbitrage” trade?
- Idiosyncratic risk–What if an earthquake destroys Ford HQ, but GM finds a hidden gold mine buried under one of their manufacturing plants?
- Noise trader risk–markets can remain irrational longer than you can remain solvent. What if Ford drops to $6 and GM goes to $15?
- Horizon risk–What if it takes 10 years for Ford to reach fundamental value? One may have been better off investing in treasury bills.
- Transaction Costs–B/A spreads? Price impacts? Short sell costs (rebate fees)?
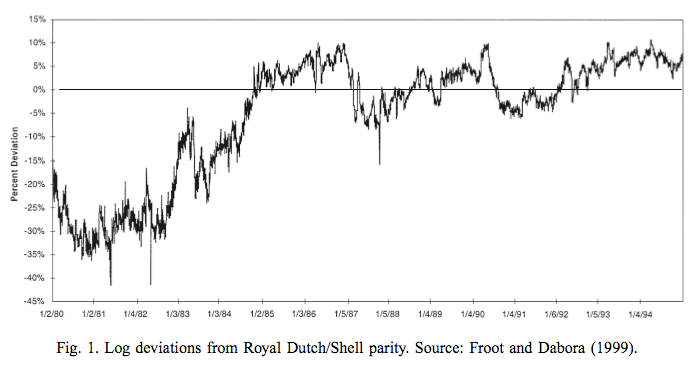
After considering the various limits of arbitrage, the mispriced Ford shares, while interesting, are certainly not a free lunch. Some other examples: Royal Dutch/Shell parity. Royal Dutch owns 60% of the cash flow rights; Shell owns 40%. In theory, the price of Royal Dutch should equal 1.5 times the price of Shell.
 Relative Value Arbitrage. Negative stub investments are a classic case of “arbitrage.” But as Mitchell, Pulvino, and Stafford (2002) show, it ain’t a free lunch!
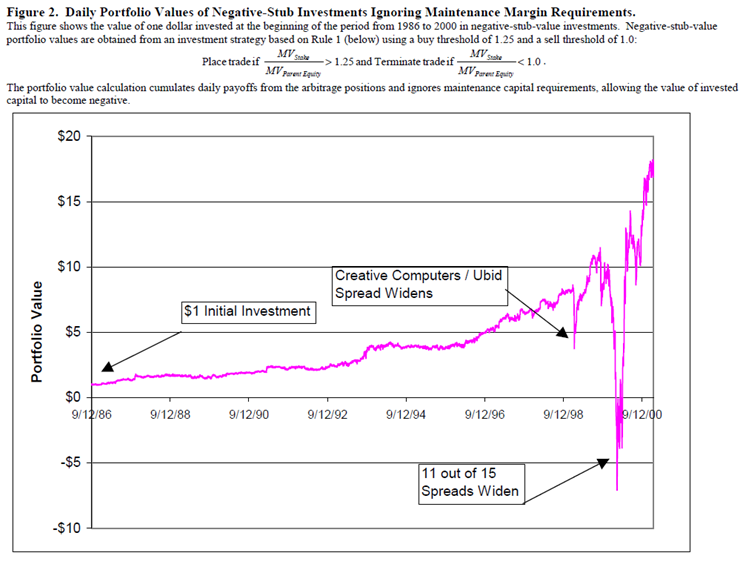
The results are hypothetical results and are NOT an indicator of future results and do NOT represent returns that any investor actually attained. Indexes are unmanaged, do not reflect management or trading fees, and one cannot invest directly in an index. Additional information regarding the construction of these results is available upon request.
The results are hypothetical results and are NOT an indicator of future results and do NOT represent returns that any investor actually attained. Indexes are unmanaged, do not reflect management or trading fees, and one cannot invest directly in an index. Additional information regarding the construction of these results is available upon request.
Porsche/Volkswagen. Who can forget the massive short squeeze on the “great trade” hawked by every hedge fund on the planet. They all got their faces ripped off…
Where can I learn more?
Here are some discussions on the topic
https://alphaarchitect.com//2013/12/17/what-is-behavioral-finance/
https://alphaarchitect.com//2014/05/20/introduction-behavioral-finance-part-2-limits-arbitrage/
About the Author: Wesley Gray, PhD
—
Important Disclosures
For informational and educational purposes only and should not be construed as specific investment, accounting, legal, or tax advice. Certain information is deemed to be reliable, but its accuracy and completeness cannot be guaranteed. Third party information may become outdated or otherwise superseded without notice. Neither the Securities and Exchange Commission (SEC) nor any other federal or state agency has approved, determined the accuracy, or confirmed the adequacy of this article.
The views and opinions expressed herein are those of the author and do not necessarily reflect the views of Alpha Architect, its affiliates or its employees. Our full disclosures are available here. Definitions of common statistics used in our analysis are available here (towards the bottom).
Join thousands of other readers and subscribe to our blog.