Deflating Profitability
- Ball, Gerakos, Linnainmaa, and Nikolaev
- A version of the paper can be found here.
- Want a summary of academic papers with alpha? Check out our Academic Research Recap Category!
Abstract:
Gross profit scaled by book value of total assets predicts the cross-section of average returns. Novy-Marx (2013) concludes that it outperforms other measures of profitability such as earnings, cash flows, and dividends. One potential explanation for the measure’s predictive ability is that its numerator – gross profit – is a cleaner measure of economic profitability. An alternative explanation lies in the measure’s deflator. We find that net income equals gross profit in predictive power when both measures are constructed using consistent deflators. We then construct an alternative measure of profitability, operating profitability, which better matches current expenses with current revenue. This measure exhibits a far stronger link with expected returns than either net income or gross profit.
Alpha Highlight:
Novy-Marx (2013) documents that gross profits over total assets has greater predictive ability than net income over book value.
The measure has received a fair amount of hoopla:
Regardless of why it took so long to become accepted, there isn’t any denying how quickly gross profitability has caught on. Last December, MSCI launched a new set of benchmarks—known as Quality Indexes—that are based on a variant of profitability. In March, after several years of using profitability in constructing their institutional offerings, AQR launched three mutual funds that also employ profitability. Dimensional Fund Advisors launched four such funds in December and another in June.
When there is an opportunity to sell, you can be sure large asset managers will sell it!
But is gross profits really that fascinating?
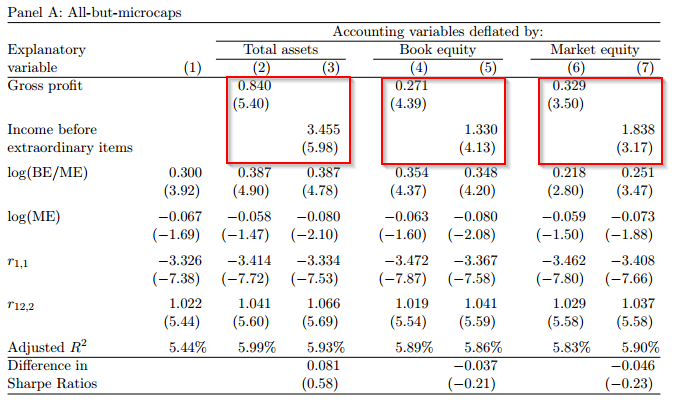
What happens when you deflate both variables (gross profits and net income) by the same variable (total assets)? They have the same predictive ability! The table below shows the T-stats are almost the same (and sometimes even higher for net income) –> the deflator (denominator) matters!
Why did Novy-Marx (2013) deflate gross profits and net income by different variables?
Prior research (e.g., the series of papers by Fama and French and Novy-Marx (2013)) recommends that when constructing a profitability measure the numerator and denominator should match with respect to cash flow rights. Namely, if the profit measure in the numerator represents a flow to equity holders (i.e., net income), then the denominator should represent an equity-holder claim (i.e., either the book or market of value equity). And, if the profit measure in the numerator represents flows to both equity- and debt-holders (i.e., gross or operating profit, calculated without deducting interest expense), then the denominator should be total assets. If the hypothesis is that explanatory power is increased by not matching the numerator and denominator based on cash flow rights, we would observe greater explanatory power whenever they are not matched. Alternatively, if the hypothesis is that explanatory power is decreased by mismatching the numerator and denominator, we would observe lower explanatory power for all mismatches. In the data, neither hypothesis is the case|the explanatory power is always highest when deflating by the book value of total assets, intermediate when deflating by the book value of equity, and lowest when deflating by the market value of equity. This ordering occurs regardless of whether the numerator and denominator match with respect to cash ow rights. The dominant mismatch appears to be between the deflators of the dependent and independent variables and not between the numerator and denominator of the earnings measure.
Sounds a lot like an exercise in data-mining, followed by a story to justify the use of gross profits. From a statistical standpoint, using gross profits or net income over total assets achieves the same outcome.

About the Author: Jack Vogel, PhD
—
Important Disclosures
For informational and educational purposes only and should not be construed as specific investment, accounting, legal, or tax advice. Certain information is deemed to be reliable, but its accuracy and completeness cannot be guaranteed. Third party information may become outdated or otherwise superseded without notice. Neither the Securities and Exchange Commission (SEC) nor any other federal or state agency has approved, determined the accuracy, or confirmed the adequacy of this article.
The views and opinions expressed herein are those of the author and do not necessarily reflect the views of Alpha Architect, its affiliates or its employees. Our full disclosures are available here. Definitions of common statistics used in our analysis are available here (towards the bottom).
Join thousands of other readers and subscribe to our blog.