Do Short-Sellers Profit from Mutual Funds? Evidence from Daily Trades
- Arif, Ben-Rephael and Lee
- A version of the paper can be found here.
- Want a summary of academic papers with alpha? Check out our Academic Research Recap Category!
Abstract:
Using high resolution data, we show that short-sellers (SSs) systematically profit from mutual fund (MF) flows. At the daily level, SSs trade strongly in the opposite direction to MFs. This negative relation is associated with the expected component of MF flows (based on prior days’ trading), as well as the unexpected component (based on same-day flows). The ability of SS trades to predict stock returns is up to 3 times greater when MF flows are in the opposite direction. The resulting wealth transfer from MFs to SSs is most pronounced for high-MF-held, low-liquidity firms, and is much larger during periods of high retail sentiment.
Alpha Highlight:
Sharpe (1991) argued that alpha is a “zero-sum” game. That is, some smart, informed traders in the market do transfer wealth from other traders by exploiting and utilizing their interactions. In this paper, the authors shed a light on the daily interactions and wealth transfers between two groups:
- Mutual funds (MFs): a major source of active trading is managed by mutual fund managers, and most funds are prohibited from taking short positions.
- Short sellers (SSs): another important group of active traders who may have superior information processing capabilities.
We’ve seen from previous posts that Hedge Funds frontrun mutual funds. So we already know that mutual fund shareholders get picked off by so-called smart money. This paper highlights a specific channel through which mutual fund shareholders get exploited: short-sellers.
This paper hypothesizes that short sellers (SSs) may have superior information resources or higher processing speed, and thus can exploit mutual fund (MFs) traders’ patterns.
This paper answers two questions:
- What’s the lead-lag relationship between the level of daily trading between MFs and SSs?
- Do MF and SS interactions have implications for future stock returns? If so, how do SSs exploit the benefits?
Key Findings:
This paper has a comprehensive set of findings. Below we only highlight the most interesting empirical findings:
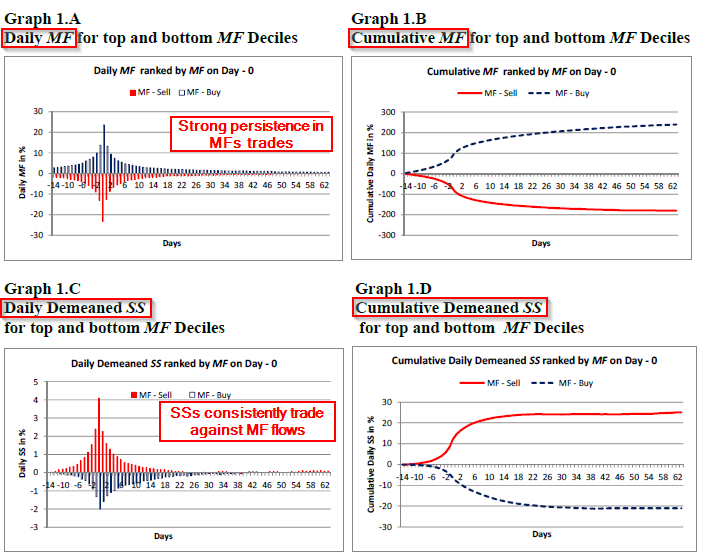
- Daily SSs and MFs trades are highly interdependent. In particular, SSs consistently trade against MF flows. Lagged MFs net purchases can negatively predict SSs.
The results are hypothetical results and are NOT an indicator of future results and do NOT represent returns that any investor actually attained. Indexes are unmanaged, do not reflect management or trading fees, and one cannot invest directly in an index. Additional information regarding the construction of these results is available upon request.
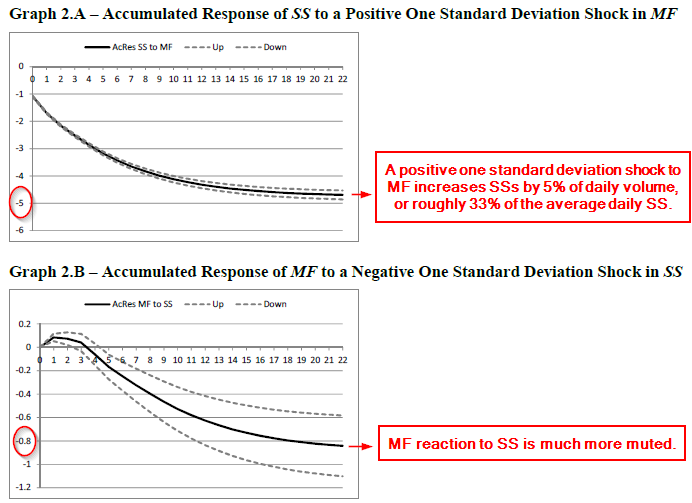
- The graph below shows that SSs consistently trade against MF flows: A positive one standard deviation shock to MF increases SSs by 5% of daily volume, or roughly 33% of the average daily SSs (most trend happens in the next 10 trading days).
The results are hypothetical results and are NOT an indicator of future results and do NOT represent returns that any investor actually attained. Indexes are unmanaged, do not reflect management or trading fees, and one cannot invest directly in an index. Additional information regarding the construction of these results is available upon request.
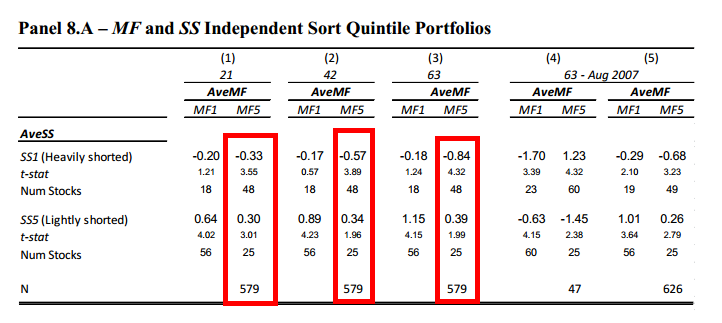
- Panel 8(A) shows what happens when SSs trades against MFs (i.e., when they are in different trading directions). Col 1, col 2, and col 3, represent the cumulative abnormal return (controlling for DGTW portfolios) over 21, 42, and 63 days, respectively. Panel A highlights that when mutual funds are buying and short sellers are selling, mutual funds take the loss.
- MF1 denotes heavy mutual fund selling, and MF5 denotes heavy mutual fund buying. SS1 denotes heaviest short selling, and SS5 denotes lightest short selling.
The results are hypothetical results and are NOT an indicator of future results and do NOT represent returns that any investor actually attained. Indexes are unmanaged, do not reflect management or trading fees, and one cannot invest directly in an index. Additional information regarding the construction of these results is available upon request.
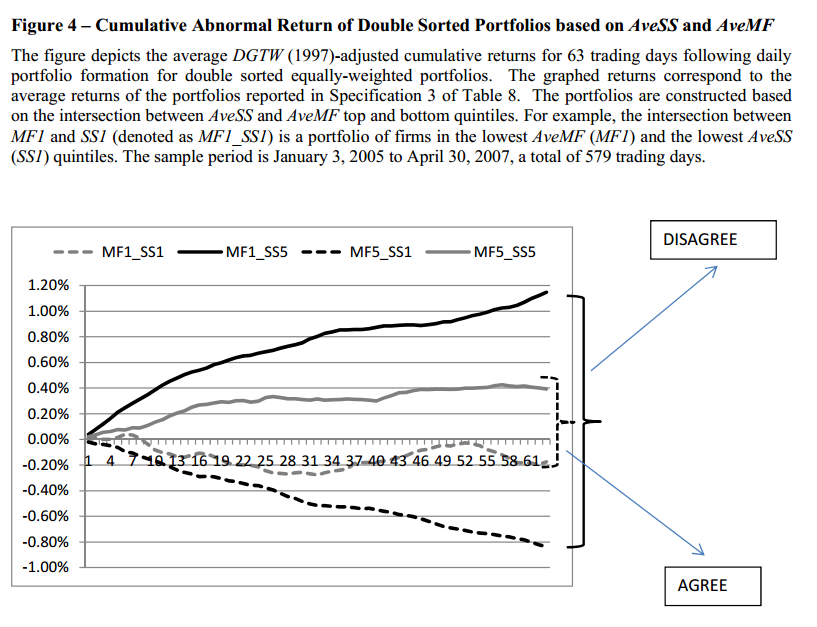
Here are the cumulative abnormal returns:
The results are hypothetical results and are NOT an indicator of future results and do NOT represent returns that any investor actually attained. Indexes are unmanaged, do not reflect management or trading fees, and one cannot invest directly in an index. Additional information regarding the construction of these results is available upon request.
Wow. When mutual funds are buying hand over fist and short sellers are selling hand over fist, mutual funds are losing out in a big way. The wealth transfer ranges from 80 bps to almost 120 bps every 3 months depending on which version of the “mutual fund exploitation” trade one is examining. That translates into a ~3-5% annual transfer.

About the Author: Wesley Gray, PhD
—
Important Disclosures
For informational and educational purposes only and should not be construed as specific investment, accounting, legal, or tax advice. Certain information is deemed to be reliable, but its accuracy and completeness cannot be guaranteed. Third party information may become outdated or otherwise superseded without notice. Neither the Securities and Exchange Commission (SEC) nor any other federal or state agency has approved, determined the accuracy, or confirmed the adequacy of this article.
The views and opinions expressed herein are those of the author and do not necessarily reflect the views of Alpha Architect, its affiliates or its employees. Our full disclosures are available here. Definitions of common statistics used in our analysis are available here (towards the bottom).
Join thousands of other readers and subscribe to our blog.